Measuring Success: Diversity foundation
Metric: Underrepresented Students
UAB shares a commitment that the diversity of its students is important in fulfilling the mission of providing a high-quality education. The percentage of diverse students provides data to assess progress. In addition to an overall count of underrepresented students, the charts below also list current data and goals for underrepresented students and female students in Science, Technology, Engineering and Math (STEM) undergraduate majors or graduate programs. UAB has an emphasis on STEM fields in its degree offerings. Nationally, underrepresented and female students represent a small number of those choosing STEM fields. Measuring the percentage of underrepresented and female students in STEM fields allows us to assess our representation.
Scroll down or use the links below to go directly to each chart.
Underrepresented Students (overall)
Underrepresented Students in STEM
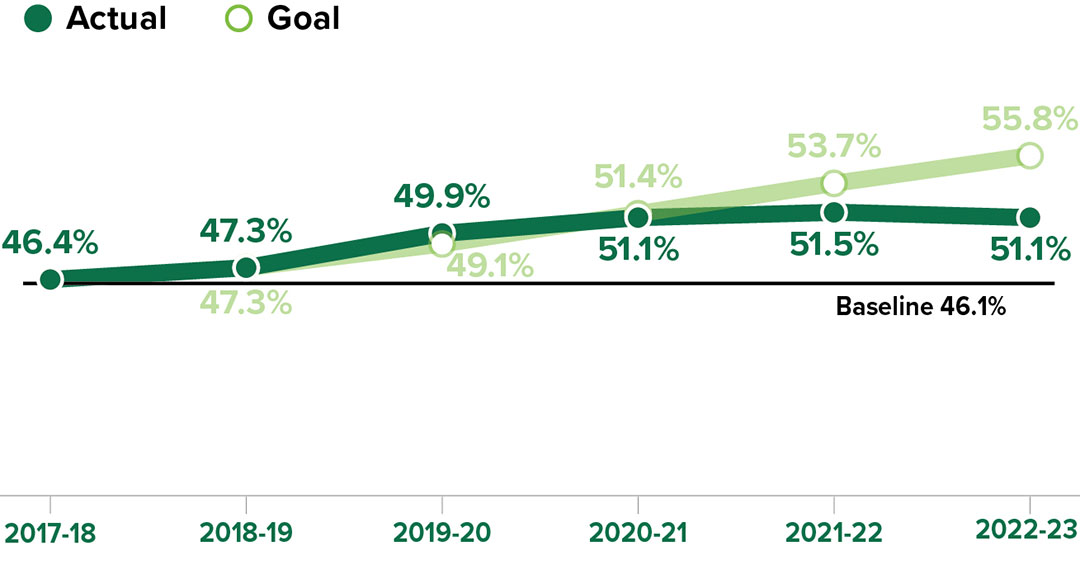
Underrepresented Students
Data definition: : Underrepresented students as percentage of UAB student body (Fall Term). Underrepresented race/ethnicity* categories include: American Indian or Alaskan Native, Asian, Black or African American, Hispanic/Latino, Native Hawaiian or Other Pacific Islander, Non-Resident Alien, Two or More Races. Baseline figure represents a three-year historical average from Fall 2015, Fall 2016, and Fall 2017. Source: Institutional Effectiveness and Analysis.
*Race/ethnicity categories developed in 1997 by the federal government are used to describe groups to which individuals belong, identify with or belong in the eyes of the community. The categories do not denote scientific definitions of anthropological origins. The designations are used to categorize U.S. citizens, resident aliens and other eligible non-citizens.
*Preliminary as of 9-16-21
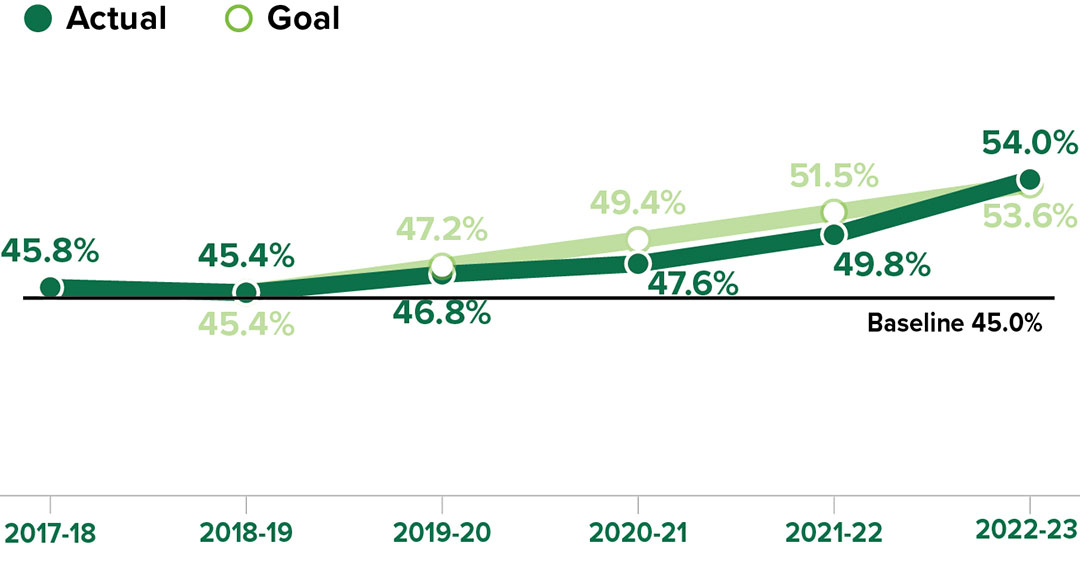
Underrepresented Students in STEM
UAB has an emphasis on Science, Technology, Engineering and Math (STEM) fields in its degree offerings. Nationally, underrepresented students represent a small number of those choosing STEM fields. Measuring the percentage of underrepresented students in STEM fields (undergraduate and graduate) allows us to assess our representation.
Data definition: Underrepresented STEM students as percentage of all STEM students at UAB (there were 4,275 total STEM students at UAB as of the Fall 2017 Census, undergraduate and graduate). STEM fields as identified by the federal government. Underrepresented race/ethnicity* categories include: American Indian or Alaskan Native, Asian, Black or African American, Hispanic/Latino, Native Hawaiian or Other Pacific Islander, Non-Resident Alien, Two or More Races. Baseline figure represents a three-year historical average from Fall 2015, Fall 2016, and Fall 2017. Source: Institutional Effectiveness and Analysis.
*Race/ethnicity categories developed in 1997 by the federal government are used to describe groups to which individuals belong, identify with or belong in the eyes of the community. The categories do not denote scientific definitions of anthropological origins. The designations are used to categorize U.S. citizens, resident aliens and other eligible non-citizens.
*Preliminary as of 9-16-21
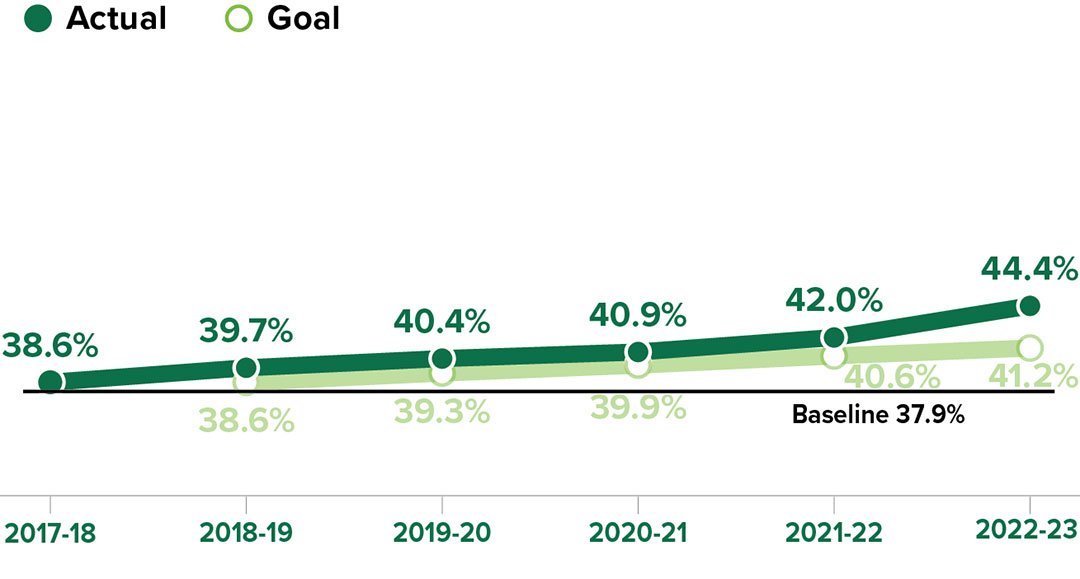
Female Students in STEM
UAB has an emphasis on Science, Technology, Engineering and Math (STEM) fields in its degree offerings. Nationally, female students represent a small number of those choosing STEM fields. Measuring the percentage of female students (undergraduate and graduate) in STEM at UAB allows us to assess our representation.
Data definition: Female STEM students as percentage of all STEM students (there were 4,275 total STEM students at UAB as of the Fall 2017 Census, undergraduate and graduate). STEM fields as identified by the federal government. Baseline figure represents a three-year historical average from Fall 2015, Fall 2016, and Fall 2017. Source: Institutional Effectiveness and Analysis.