
The world looks to scientists to both discover information that explains life and its various phenomena and interpret that information. Scientific discoveries and theories are then considered when developing policies in various areas and at all levels of government. One example of the use of science in policy development at a local level is the fluoridation of water sources in order to prevent tooth decay. The State of Alabama does not mandate fluoridation of all water systems, but rather local governments control fluoridation systems1. A more global example is the creation of the Paris Climate Agreement, which commits governments around the world to using clean sources of energy rather than fossil fuels2. Thus, science affects everyone around the world everyday. But what if science was wrong? What if the data gathered by scientists was not correctly evaluated? Unfortunately, erroneous science is a larger problem than many people realize or would like to admit. This is in large part due to the incorrect evaluation of data.
Author: Emily Jennings
The world looks to scientists to both discover information that explains life and its various phenomena and interpret that information. Scientific discoveries and theories are then considered when developing policies in various areas and at all levels of government. One example of the use of science in policy development at a local level is the fluoridation of water sources in order to prevent tooth decay. The State of Alabama does not mandate fluoridation of all water systems, but rather local governments control fluoridation systems1. A more global example is the creation of the Paris Climate Agreement, which commits governments around the world to using clean sources of energy rather than fossil fuels2. Thus, science affects everyone around the world everyday. But what if science was wrong? What if the data gathered by scientists was not correctly evaluated? Unfortunately, erroneous science is a larger problem than many people realize or would like to admit. This is in large part due to the incorrect evaluation of data.
The incorrect evaluation of data can be the result of many different issues. Among them is insufficient understanding of the use of programs used to analyze data. For example, earlier this year, a group of researchers working for The Baker IDI Heart and Diabetes Institute, an independent research institute in Melbourne, Australia, found that 704 out of a sample of 3,597 published scientific papers contain gene name errors3. According to Science Magazine, these results indicate that one in five genetics papers contain errors4. These errors were found to be a result of researchers not changing a setting in Microsoft Excel that converts the names of certain gene short names to dates3. Such errors could be prevented by researchers taking the time to understand and change settings in the software they use to analyze data.
Another issue is the use of inadequate sample sizes. Inadequate sample sizes can prevent the detection of the true effect of an experiment. In other words, small sample sizes decrease the chance of detecting (and rejecting) a false null hypothesis in an experiment, thus increasing the chance of the occurrence of a Type II error (a false negative) and decreasing the statistical power of the experiment. If an experiment is underpowered due to a small sample size, it is unlikely that a significant effect will be found between the control and the experimental groups. Also, the lower the power of a study, the less likely that study is reproducible5. Reproducibility is very important for studies because if a study cannot be reproduced, then it is not reliable and cannot be used to progress knowledge. Lack of reproducibility in relation to small sample sizes has lately come to light as being a major problem in the field of psychology. In August 2015, Nature reported that over half of psychology studies fail reproducibility tests.4 According to the article, in the largest replication study to date, Brian Nosek, a social psychologist, and 269 other researchers replicated the work presented in 98 papers from three psychology journals. The replication study was very broad, as the studies replicated ranged from whether expressing insecurities causes differences in how children and adults respond to fear stimuli to effective ways of teaching math, allowing a generalization to all studies within the field of psychology.4 The scientists completed 100 replication attempts on the 98 papers (because there were two instances in which replication efforts were duplicated by two separate teams), and of those 100 replication attempts, 39 were successful6. Nosek and his fellow researchers also considered whether a statistically significant effect could be found in those reproduced experiments, and discovered that only 36% of the reproduced studies found significant results, compared to the 97% of the original studies that had found significant results6. This lack of reproducibility and reliable results can be improved by raising the statistical power of studies through better study design that incorporates larger sample sizes without causing waste, increases the effect size, decreases the random error of the studies, or increases the alpha level of the study7.
Erroneous data evaluation can also be attributed to a lack of a solid understanding of statistics among researchers. The American Statistical Association issued a statement in the Spring of 2016 warning that the misuse of the P value is resulting in a number of experiments that cannot be reproduced8. This misuse of the P value is in large part due to a lack of understanding of the proper application of the P value when analyzing data. A P value of a certain decimal does not represent chance that a given hypothesis is correct8. It means that if the null hypothesis is true and all other assumptions made are valid, then there is a percentage chance of finding a result as extreme as the one observed8. For example, looking at the curve in Figure 1, the chunk of blue indicates 5% of the area under the curve, or a P value of 0.05. This means that if the null hypothesis of whatever experiment was done is true and all other assumptions are valid, then there is a 5% chance of obtaining a value as extreme as the one observed in the experiment for which the curve was generated. This does not mean that there is a 95% chance that the alternate hypothesis is true. A P value should not be used to determine the significance of a finding, especially since they can be misleading or used in a way that makes them misleading if not interpreted correctly. Because of this, the American Statistical Association suggests that researchers not draw conclusions based on P values or statistical tests that yield significant results, but rather describe all statistical tests and all choices made in calculations8. Another way of fixing the issue of erroneous data analysis due to lack of understanding of statistics may be to place a heavy emphasis on statistics in all graduate and undergraduate programs that produce researchers. If statistics is correctly ingrained in the minds of future scientists, perhaps future studies would be less prone to unreliability.
Figure 1. Blue shading of 5% of the area under a curve indicates that a P value of 0.05 has been selected9.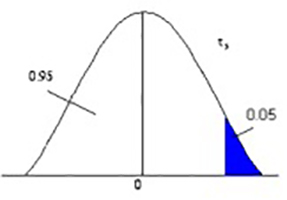
Without correct statistical analysis, scientific publications really mean nothing. If a set of data cannot be or has not been properly analyzed, the implications put forth by authors of such data are completely invalid and not sound. Such data cannot be used to contribute to the improvement of the world, and would ultimately mean that time, money, and resources were wasted. The misuse of time, money, and resources could lead to the distrust of science by the general populace, and such distrust could lead to a lack of willingness of governments and donors to contribute financially to science education and research. Such a lack of funding would be detrimental to all fields of science and medicine and would greatly hinder the progress of knowledge.
References
- State fluoride database. (2016). Fluoridealert.org. Retrieved from http://fluoridealert.org/researchers/states/alabama/. [accessed 6 November 2016]
- Paris climate deal enters force as focus shifts to action. (2016, November 4). BBC.co.uk. Retrieved from http://www.bbc.co.uk/news/science-environment-37872111. [accessed 6 November 2016]
- Microsoft Excel blamed for gene study errors. (2016, August 25). BBC.co.uk. Retrieved from http://www.bbc.co.uk/news/technology-37176926. [accessed 24 October 2016]
- One in five genetics papers contains errors thanks to Microsoft Excel. (2016, August 29). Sciencemag.org. Retrieved from https://www.sciencemag.org/news/sifter/one-five-genetics-papers-contains-errors-thanks-microsoft-excel. [accessed 24 October 2016]
- Button, K.S., Flint, J., Ioannidis, P.A., Mokrysz, C., Munafò, M.R., Nosek, B.A. & Robinson, E.S.J. Power failure: why small sample size undermines the reliability of neuroscience. Nature Reviews Neuroscience 14, 365-376 (May 2013).
- Over half of psychology studies fail reproducibility test. (2015, August 27). Nature.com. Retrieved from http://www.nature.com/news/over-half-of-psychology-studies-fail-reproducibility-test-1.18248. [accessed 24 October 2016]
- Collins, L.M. & Hansen, W.B. Seven ways to increase power without increasing N. NIDA Research Monographs 142, 184-195 (1994).
- Statisticians issue warning over misuse of P values. (2016, March 7). Nature.com. Retrieved from http://www.nature.com/news/statisticians-issue-warning-over-misuse-of-p-values-1.19503. [accessed 24 October 2016]
- Statistical Inference. (2016). Surfstat.anu.edu.au. Retrieved from https://surfstat.anu.edu.au/surfstat-home/4-1-6.html. [accessed 24 October 2016]