
Strontium titanate is a material of considerable interest for electronic applications. A recent study revealed that strontium titanate (STO) annealed in strontium oxide (SrO) powder exhibits large persistent photoconductivity (PPC) after exposed to sub-bandgap light of 2.9 eV or higher. To better understand this phenomenon a titanium dioxide (TiO2) annealing treatment was applied to STO substrate to see if this property would be exhibited under altered conditions. Using electron paramagnetic resonance (EPR) spectroscopy, Fe3+ and Cr3+ defects were detected in as-received STO samples. After annealing the samples, Fe3+ defects were not detected in both the SrO and TiO2 annealed samples; moreover, the signal intensity of Cr3+ defect decreased by no more than 20% for both annealed samples. To further study the samples we applied light illumination, also referred to as photo-EPR, by using LEDs and laser diodes that ranged from 1550 to 397 nm. Similar behavior was seen in both the SrO and TiO2 annealed samples in which the Cr3+ signal intensity reduced by at least two orders of magnitude; however, the TiO2 annealed sample did not exhibit this “giant” PPC. These results imply that Cr3+ is not responsible for this novel property. Ongoing studies are necessary to better understand what defect is responsible for this significant change in the electronic properties of STO.
Brianna Kenney1, Subash Paude2, Jamiyanaa Dashdorj, Ph.D.3, Mary Ellen Zvanut, Ph.D.2, Violet Poole4, Matthew McCluskey4
1Alabama A&M University, Normal, AL, USA
2Department of Physics, University of Alabama at Birmingham, Birmingham, AL, USA
3Chatham University, Pittsburgh, PA, USA
4Department of Physics & Astronomy, Washington State University, Pullman, WA, USA
Abstract
Strontium titanate is a material of considerable interest for electronic applications. A recent study revealed that strontium titanate (STO) annealed in strontium oxide (SrO) powder exhibits large persistent photoconductivity (PPC) after exposed to sub-bandgap light of 2.9 eV or higher. To better understand this phenomenon a titanium dioxide (TiO2) annealing treatment was applied to STO substrate to see if this property would be exhibited under altered conditions. Using electron paramagnetic resonance (EPR) spectroscopy, Fe3+ and Cr3+ defects were detected in as-received STO samples. After annealing the samples, Fe3+ defects were not detected in both the SrO and TiO2 annealed samples; moreover, the signal intensity of Cr3+ defect decreased by no more than 20% for both annealed samples. To further study the samples we applied light illumination, also referred to as photo-EPR, by using LEDs and laser diodes that ranged from 1550 to 397 nm. Similar behavior was seen in both the SrO and TiO2 annealed samples in which the Cr3+ signal intensity reduced by at least two orders of magnitude; however, the TiO2 annealed sample did not exhibit this “giant” PPC. These results imply that Cr3+ is not responsible for this novel property. Ongoing studies are necessary to better understand what defect is responsible for this significant change in the electronic properties of STO.
Introduction
Advancements in technology are being introduced every day. These improvements have caused technology to grow exponentially. With production expanding at a steady pace, analytical researchers are investigating new ways to continue this phenomenon. Materials play a major role in this evolution of technology. Recently complex oxides have been a topic of interest; because of their unique properties they are promising for electronic applications. In particular, strontium titanate (STO) with perovskite structure exhibits advantageous dielectric, piezoelectric, and ferroelectric properties that can be observed at low temperatures. Two notable characteristics of this perovskite oxide are its high dielectric constant (approximately 300 at room temperature) and wide band gap (3.2 eV). A wide band gap makes it beneficial for high temperature applications. 1,2
Strontium titanate with the general formula ABO3 has a simple cubic perovskite structure at room temperature, consisting of a simple cubic lattice of 8 strontium atoms occupying each corner, 6 oxygen atoms at the face center, and 1 titanium atom at the body center as seen in Fig. 1.3 This structure is often altered by the presence of defects. Some common defects found in strontium titanate are transition metals such as Fe3+ and Cr3+ that are often accompanied by the creation of oxygen vacancies. These defects typically replace titanium atoms. The concentration of defects in STO determines the magnitude of the conductivity and also gives rise to many other properties such as localized conductivity and electron doping.4 When considering technological applications, it is vital to understand the defect and how its structure plays a role in this phenomenon of new properties.
During this ten-week study we investigated STO samples received from Washington State University that were categorized as “annealed” or “as-received”. The purpose of this investigation was to determine what defects are responsible for persistent photoconductivity as recently seen in STO annealed with strontium oxide (SrO) using electron paramagnetic spectroscopy (EPR). This technique takes advantage of the Zeeman Effect in which an unpaired electron’s energy level splits when a magnetic field is applied as shown in Fig. 2. An EPR spectrum can be obtained by varying the magnetic field strength which causes a change in the energy difference between two spin states. A peak in the absorption occurs when the magnetic field “tunes” the two spins states so that their energy differences match the energy of radiation.5 The absorption of electromagnetic radiation affects the conductivity of the material; conductivity is increased by at least a few orders of magnitude and does not return to its natural state. This effect is referred to as persistent photoconductivity (PPC).
Experimental Details
Sample Preparation
A Bruker EPR spectrometer was allowed to run for at least two hours. Prior to the experiment, the sample tubes were cleaned using xylene. The sample tubes were carefully placed inside a 250 mL beaker containing the xylene solution. Once they were submerged in the xylene, the beaker was placed inside of a Branson ultrasonic cleaner with a set 15-minute time interval. After the set time elapsed, the beaker was removed from the ultrasonic cleaner. The tubes were then removed from the beaker and the xylene was discarded. This procedure was repeated using the following solutions in the order listed: trichloroethylene (TCE), acetone, methanol, and deionized water. Once they were cleaned, we dried the tubes with nitrogen gas.
Next, the samples were mounted. To do this, rubber tubing was placed at the end of the glass rod and the sample tube was placed at the other end of the rubber, leaving a little space for flexibility. The rubber tubing was heated to tighten the sample mount. Once the sample mount was prepared, a red LED was turned on and the room lights were turned off. The as-received STO was removed from its packaging. A thin layer of Elmer’s rubber cement glue was applied to the sample, which was placed inside of the plastic sample tube and allowed to dry for 10 minutes. Once it was dry, the sample tube was secured using a Teflon collet and was aligned such that the sample’s orientation was perpendicular to the magnetic field and the length was matched to the parameters specified for efficient measurements. Next, the sample was placed such that it was centered vertically in the middle of the cavity. Once it was inside of the cavity, the sample was aligned so that the c-axis was parallel to the magnetic field. The EPR cavity was then covered to prevent any possible light exposure.
Conventional EPR Measurements
Once the sample was placed inside of the cavity, the system was tuned. To do this, the AFC and diode meter were centered while in operate mode until 23 dB was reached. Once both of the meters were centered, the system was placed in tune mode and the attenuation was raised to 25 dB in order to accurately measure the Q-value. The Q-value was recorded and the system was placed back into operate mode. The attenuation was then returned to 23 dB. Once the meters were centered and the Q-value was accumulated, indicating that the system was properly tuned, the system was ready to take measurements.
The system swept across the magnetic field in order to acquire the data. After data was saved, the sample inside of the cavity was rotated counterclockwise. This procedure was repeated until all the specified angle measurements were achieved. After all data collection, the files were imported on the data analysis and graphing software Origin7.0.
The same procedure was repeated for the remaining STO substrates that were both annealed at 1200˚C for 1 h. The samples are listed in Table 1. Literature review as well as data analysis was performed. Defect centers were identified through the EPR parameters such as the g-tensor, zero-field splitting and hyperfine energies. The number of defects was determined by double integration of the EPR signal and comparison with a calibrated weak pitch sample. For comparison with other samples, all EPR parameters were normalized.
| LED Color | λ (nm) | Eph (eV) | Pmax (mW) | Padj (mW) |
|---|---|---|---|---|
| Ultra Violet | 397 | 3.12 | 6.3 | |
| Blue-Green | 448 | 2.77 | 80 | 28.4 |
| Royal Blue | 454 | 2.73 | 25.3 | 27.8 |
| Blue | 470 | 2.64 | 64.5 | 27.5 |
| Green | 505 | 2.45 | 32.1 | 25.5 |
| Green | 530 | 2.34 | 27.7 | 23.2 |
| Red-Orange | 615 | 2.02 | 73.5 | 20.5 |
| Red | 625 | 1.98 | 73.2 | 20.3 |
| Red | 660 | 1.88 | 79.4 | 19.6 |
| LD | 785 | 1.58 | 30 | 15 |
| LD | 830 | 1.49 | 45 | 14.9 |
| LD | 1060 | 1.17 | 85 | 11.7 |
| LD | 1550 | 0.8 | 3 |
Photo-EPR Measurements
Photo-EPR measurements were obtained by illuminating the samples with diode-lasers or light emitting diodes (LED’s) covering a wavelength range from 397 to 1550 nm. The as received and TiO2 annealed samples were cut in half lengthwise using a diamond wheel saw before measurements were obtained. The volumes of each sample were listed in Table 1. The samples were cleaned after being cut.
Prior to measurement, the light sources were inspected to insure that they emitted a constant intensity (I) by using the relation, I = P/ (Eph * A), where P is the power of light source and A is the area of sample illuminated. The maximum power was measured using a Newport Power/Energy Meter Model 1825-C for each selected wavelength. The power was then adjusted in accordance to the energy that was calculated by using the conversion of nanometers to electronvolts so that the ratio of power and energy was constant for all wavelengths. To satisfy this ratio, the power was adjusted by using a neutral density filter and by changing the distance between the LEDs and sample. These adjustments for each light source were recorded in Table 2.
| Sample | Label | Volume (x 10-3/ cm3) |
Fe3+ (x 1016/ cm3) |
Cr3+ (x 1015/cm3) |
Q | PPC (yes or no) |
|---|---|---|---|---|---|---|
| 1 | As Received | 11.60 | 9.11 | 32.8 | 6900 | no |
| 2 | SrO annl. | 5.38 | <1014 | 1.93 | 3400 | yes |
| 3 | TiO2 annl. | 11.00 | <1014 | 9.72 | 6100 | no |
Before the sample was inserted into the cavity, the laser diodes and LEDs were set up on the support stand. Once the light sources were in working distance, the red LED light was turned on and the remaining lights were turned off. The sample was removed from the light insensitive packaging and mounted in the Teflon collet. The sample was carefully inserted into the cavity and aligned. Once the sample was inside of the cavity, a filter was placed in front of the cavity to prevent any light entering in while aligning the light sources. Starting from the highest wavelength, the laser diode was mounted and aligned to the center of the cavity. After it was aligned, the filter was removed from in front of the cavity and covered the system. The light source was emitted onto the sample for five minutes before acquiring data. Once the five minutes elapsed, the scan was performed with the light still illuminating the sample. The same procedure was used in addition to the suggested adjustments for the following light sources listed in Table 2 until 397 nm was achieved. After all data collection, Origin7.0 was used to further analyze our EPR signals.
Results and Discussion
Magnetic Field (G)
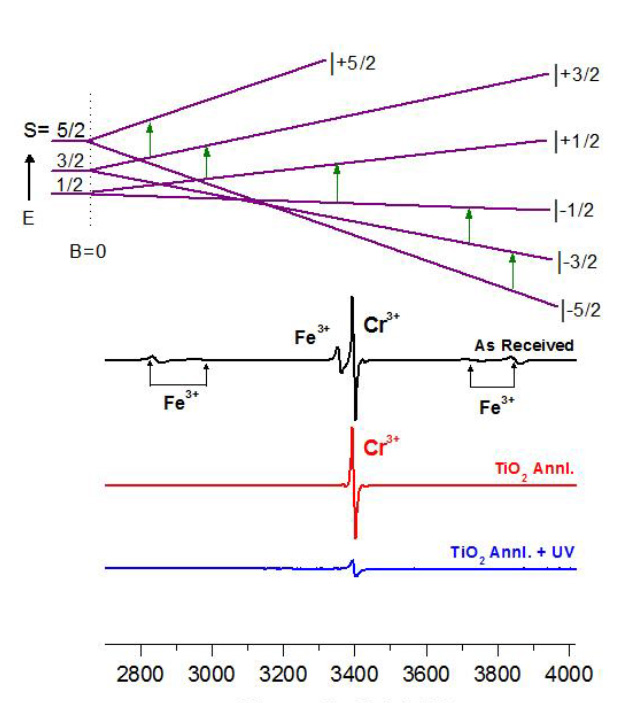
Figure 3. EPR spectra of a) as received STO, b) TiO2 annealed before illumination, and c) TiO2 annealed after illumination. Diagram shows transitions in Fe3+ ion.
EPR signals revealed the presence of Cr3+ and Fe3+ point defects in the as received STO substrate shown in Fig. 3. These defects and their known characteristics were first discovered by K.A. Muller.6,7 The central peak that belongs to Cr3+ ion, located at ~3400 G with a calculated g-value of 1.977 ± 0.001, was found to be isotropic after recording EPR signals at different angles between the c-axis and the magnetic field. After acquiring data at Cr3+ optimum parameters, the spectrum revealed the well resolved four hyperfine lines with ~17.6 G magnetic field separation which is a result of nuclear spin coupling (I=3/2) of the 53Cr isotope.8 The five peaks seen in the as received sample correspond to the Fe3+ defect. These peaks relate to the allowed spin transitions with ms = 5/2, 3/2, 1/2, -1/2, -3/2, -5/2 (see inset). The intensity of the signal depends on the likelihood for the transition to occur in which the central peak with a g-value of ~1.998 corresponds to the +1/2 ↔ -1/2 spin transition. Angular dependent measurements revealed the highly anisotropic Fe3+ in which the position of the five lines varied strongly with the orientation of the sample with respect to the applied magnetic field which is consistent with literature.7
An EPR spectrum as seen in Fig. 3 also illustrates the annealing effects as well as the effect of UV illumination on strontium titanate. After annealing in TiO2 powder, the EPR intensity of Fe3+ decreased at least by a factor of 10, thus falling below detection limit, and the Cr3+ signal exhibited only a slight change in its magnitude; it decreased by no more than 20% as shown in Fig.3b. After the TiO2 annealed sample was exposed to UV light, the Cr3+ signal decreased by at least two orders of magnitude as shown in Fig.3c. The change in Q-value suggests that the substrate became conductive. Similar behavior was also seen in the SrO annealed sample in which Fe3+ was no longer detected after the annealing process. Once the sample was exposed to UV light the Cr3+ signal decreased beyond the detection limit.
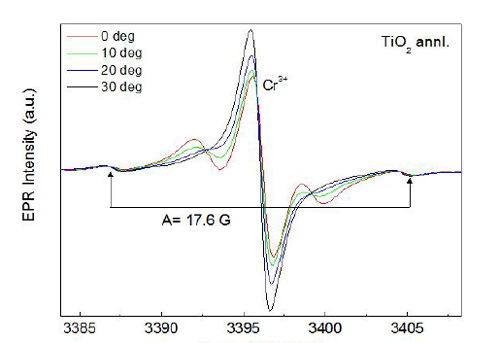
Magnetic Field (G)
The EPR spectra of TiO2 annealed sample displayed in Fig.4. magnifies the Cr3+ signal with its typical central peak located at ~3400G with a g-value of 1.979 and its two out of four hyperfine lines. In addition to the Cr3+ main peak corresponding to the -1/2↔1/2 transition, there are two peaks accompanying the central signal that are likely a result from the other allowed transitions of Cr3+ (S=3/2). To do further analysis of this signal, angle dependent measurements were performed by rotating the sample around the crystal axis with respect to the magnetic field. No shift was seen in the Cr3+ main transition line; however, the other transition lines showed angular dependence. This anisotropic signal became narrower causing a slight distortion in the central peak that appears to be increasing in magnitude as the sample’s orientation is changed with respect to the magnetic field from 0 to 30˚.
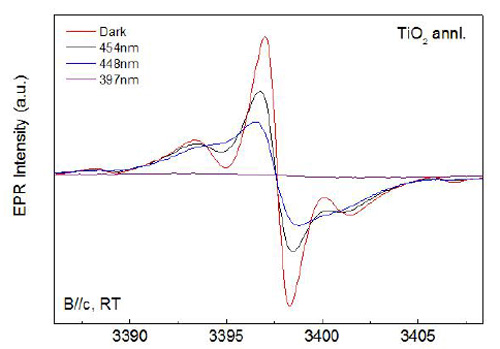
Magnetic Field (G)
Photo-EPR measurements were performed to investigate the possible defect levels and charge transfer between defects in the TiO2 annealed sample. During the experiment, no significant change was seen in the EPR signal until blue light was illuminated as shown in Fig.5. After UV illumination (397nm), the Cr3+ as well as the unidentified signal seemingly fell below the detection level. A lone broad spectrum was seen after UV illumination. Angular dependent measurements were performed after UV illumination to analyze this broad spectrum. The data revealed that the signal is isotropic suggesting that this is not the same unknown signal seen before illumination. To study the effects of photon energy on the point defects, the difference in the signals’ magnitude was measured. The broad signal showed similar photo responses to Cr3+ defect center. The energy threshold for the Cr3+ signal and unknown signal is ~2.5 eV. The similar behavior suggests that this unidentified defect could be due to the Cr3+ defect. Further investigation is necessary to confirm this.
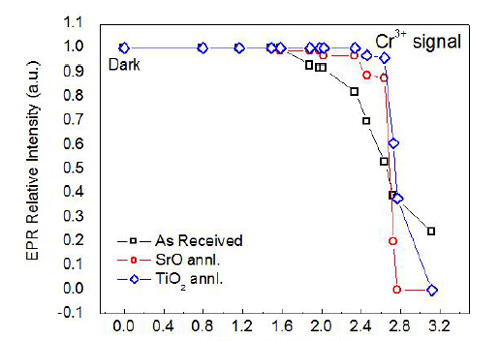
Magnetic Field (G)
After photo-EPR measurements, data analysis was performed to compare the Cr3+ defect seen in all STO samples, as illustrated in Fig. 6. The relative EPR intensity of Cr3+ defect decreased in all STO samples. It can be inferred that this is due to the changes in the charge state. The black data line representing the Cr3+ defect in the as received STO displayed a lower energy threshold ~1.9 eV. After UV illumination the Cr3+ signal could still be detected. This detail suggests that annealing plays a role in the electronic properties of the strontium titanate substrate. The red line that corresponds the Cr3+ defect seen in SrO annealed sample is almost identical to the blue line that represents the Cr3+ defect seen in the TiO2 annealed sample. Both of the data sets display a plateau until ~2.3 eV is reached. Although the rate of decrease is slightly different, it is believed that this is due to error bars. These results highlight how two different annealing treatments exhibited very similar properties.
Conclusion
Studying defects has become vital in understanding how their presence plays a role in many unique properties seen in perovskite oxides that are promising for electronic applications. Using the technique known as electron paramagnetic resonance spectroscopy, we were able to investigate strontium titanate treated under different conditions. Results revealed that strontium titanate annealed in titanium dioxide behaved similar to the strontium oxide annealed sample. After UV illumination, the intensity of the Cr3+ defect signal fell below the detection limit with an energy threshold of ~2.3 eV. Similar results were obtained for the SrO annealed sample; however, the conductivity of the TiO2 annealed sample did not increase significantly after light illumination. This analysis suggests that Cr3+ may not be the defect causing this PPC. Continuous investigation is required to gain more understanding what is causing this novel change on strontium titanate’s electronic properties.
Future Research
We believe that the two peaks seen in STO annealed in TiO2 that accompanies the central peak of Cr3+ is a result from allowed spin transitions. Numerous techniques were explored such as angular dependent measurements as well as photo-EPR measurements to analyze this signal. Further studies will be necessary to confirm our hypothesis; moreover, the bigger question of what is causing this giant persistent photoconductivity seen in SrTiO3 annealed in SrO still remains a mystery. Other research techniques may be explored to gain a better understanding.
References
- J.A. Noland. Optical Absorption of Single-Crystal Strontium Titanate. Phys. Rev. 94, 724 (1954).
- K. Benthem, C. Elsässer. Bulk electronic structure of SrTiO¬3: Experiment and theory. J. Appl. Phys. 90, 6156 (2001).
- Y. P. Cai, D. Z. Han, R. Y. Ning. Structural phase transitions in SrTiO3 nanoparticles. J. Chem. Phys. 23, 212 (2009).
- http://repositorio.ul.pt/bitstream/10451/1643/10/19741_ulsd_re487_10_Chapter2.pdf
Last accessed: July 1st, 2016. - D.P. Barr, J. Jiang, and R. T. Weber, Bruker Instruments (1998).
- K.A. Muller. EPR of photochromic Mo in SrTiO3. Proc. of the First International Conference of Paramagnetic Resonance, (Academic Press, Inc., NY, 1963).
- K.A. Muller. Paragmagnetische Resonanz von Fe3+ in SrTiO3-Einkristallen. Helv. Phys. Acta. 31, 173 (1958).
- K.A. Muller. Résonance paramagnétique du Cr3+ dans des monocristaux de SrTiO3. Arch. Sci. 11, 150 (1958).