Measuring Success: Diversity foundation
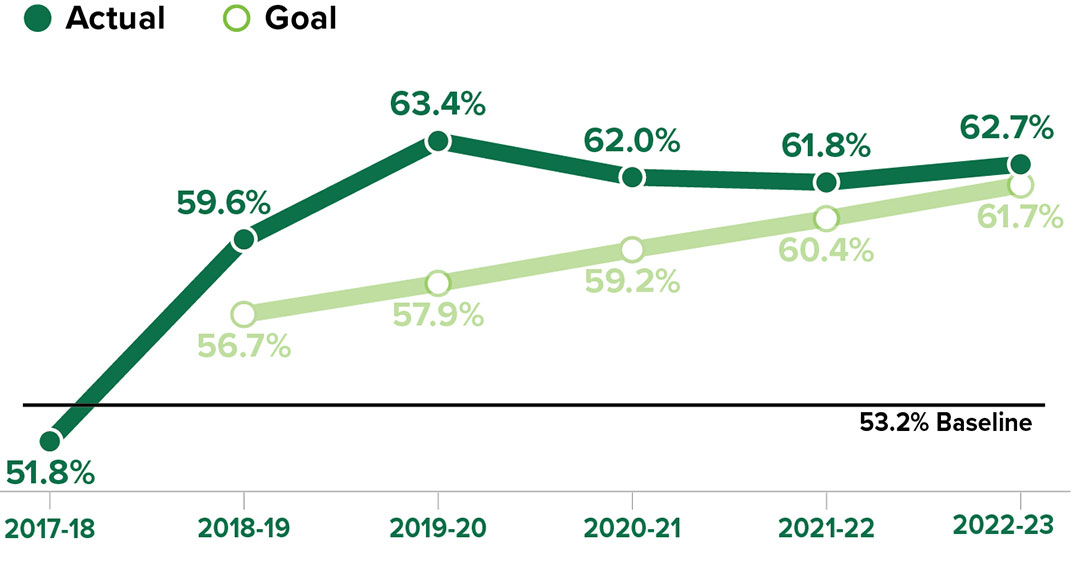
Metric: Graduation Rate by Underrepresented Students
Graduation rates by underrepresented students measure progress toward degree for this group. They for an assessment of whether there are differences in educational attainment rates for particular groups.
Data definition: Six-year graduation rate for underrepresented students. Baseline figure represents a three-year historical average from 2015-16 to 2017-18. Underrepresented race/ethnicity* categories include: American Indian or Alaskan Native, Asian, Black or African American, Hispanic/Latino, Native Hawaiian or Other Pacific Islander, Non-Resident Alien, Two or More Races. Source: Institutional Effectiveness and Analysis.
*Race/ethnicity categories developed in 1997 by the federal government are used to describe groups to which individuals belong, identify with or belong in the eyes of the community. The categories do not denote scientific definitions of anthropological origins. The designations are used to categorize U.S. citizens, resident aliens and other eligible non-citizens.