The UAB Heersink School of Medicine Immunology Institute and the O’Neal Comprehensive Cancer Center (OCCC), working in close partnership with the Flow Cytometry and Single Cell (FCSC) core, have established human IMMUNOPHENOTYPING services.
-
What is immunophenotyping?
What is immunophenotyping?
Immunophenotyping is the identification and quantitation of heterogeneous populations of cells by multi-parameter flow cytometry using a panel of fluorescently-labelled antibodies that recognize specific antigens on a cell surface, known as cell markers.
-
Why use immunophenotyping in your work?
Why use immunophenotyping in your work?
Immunophenotyping is used to monitor the molecular, metabolic, phenotypic and functional attributes of cells that circulate through the blood. Alterations in these cellular attributes, particularly over time, may be closely associated with specific disease manifestations, disease progression and responsiveness to treatment. Thus, immunophenotyping is a powerful approach to identify easily monitored biomarkers and cellular signatures that may be useful as diagnostic and prognostic indicators of disease. Immunophenotyping is particularly helpful when monitoring patients who are exposed to immunotherapies, such as checkpoint inhibitors and targeted immune modulators that are increasingly used in chronic disease settings.
-
Which immunophenotyping panels are available?
Which immunophenotyping panels are available?
-
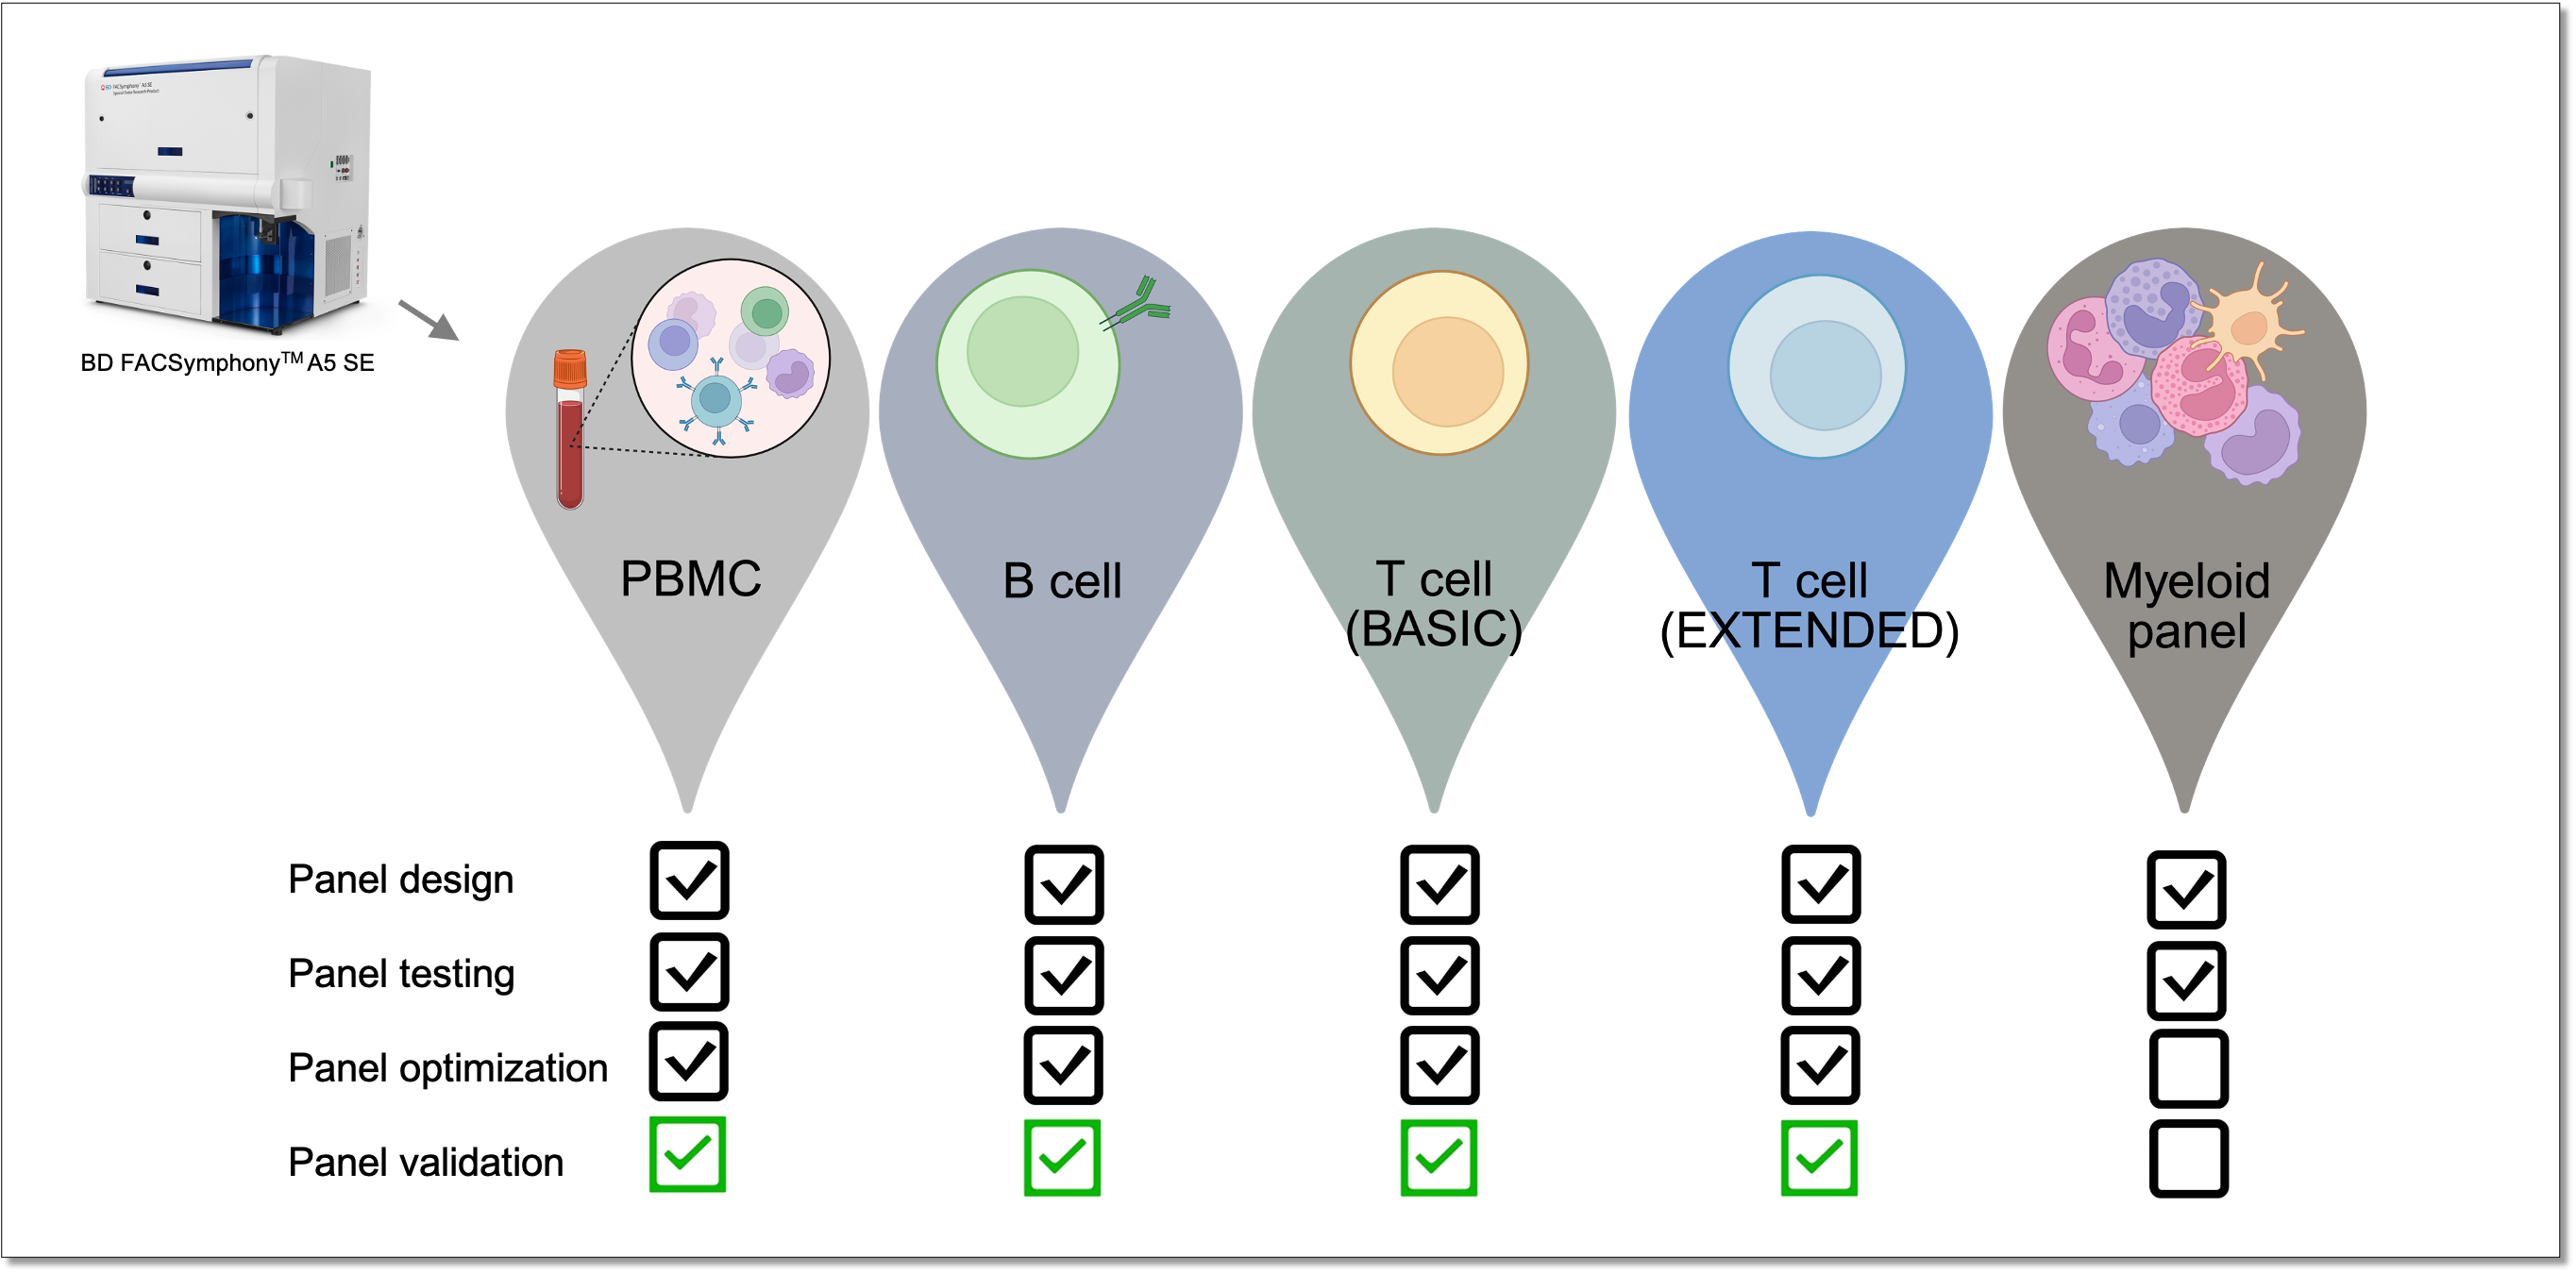
Composition of our validated PBMC, B cell and T cell panels
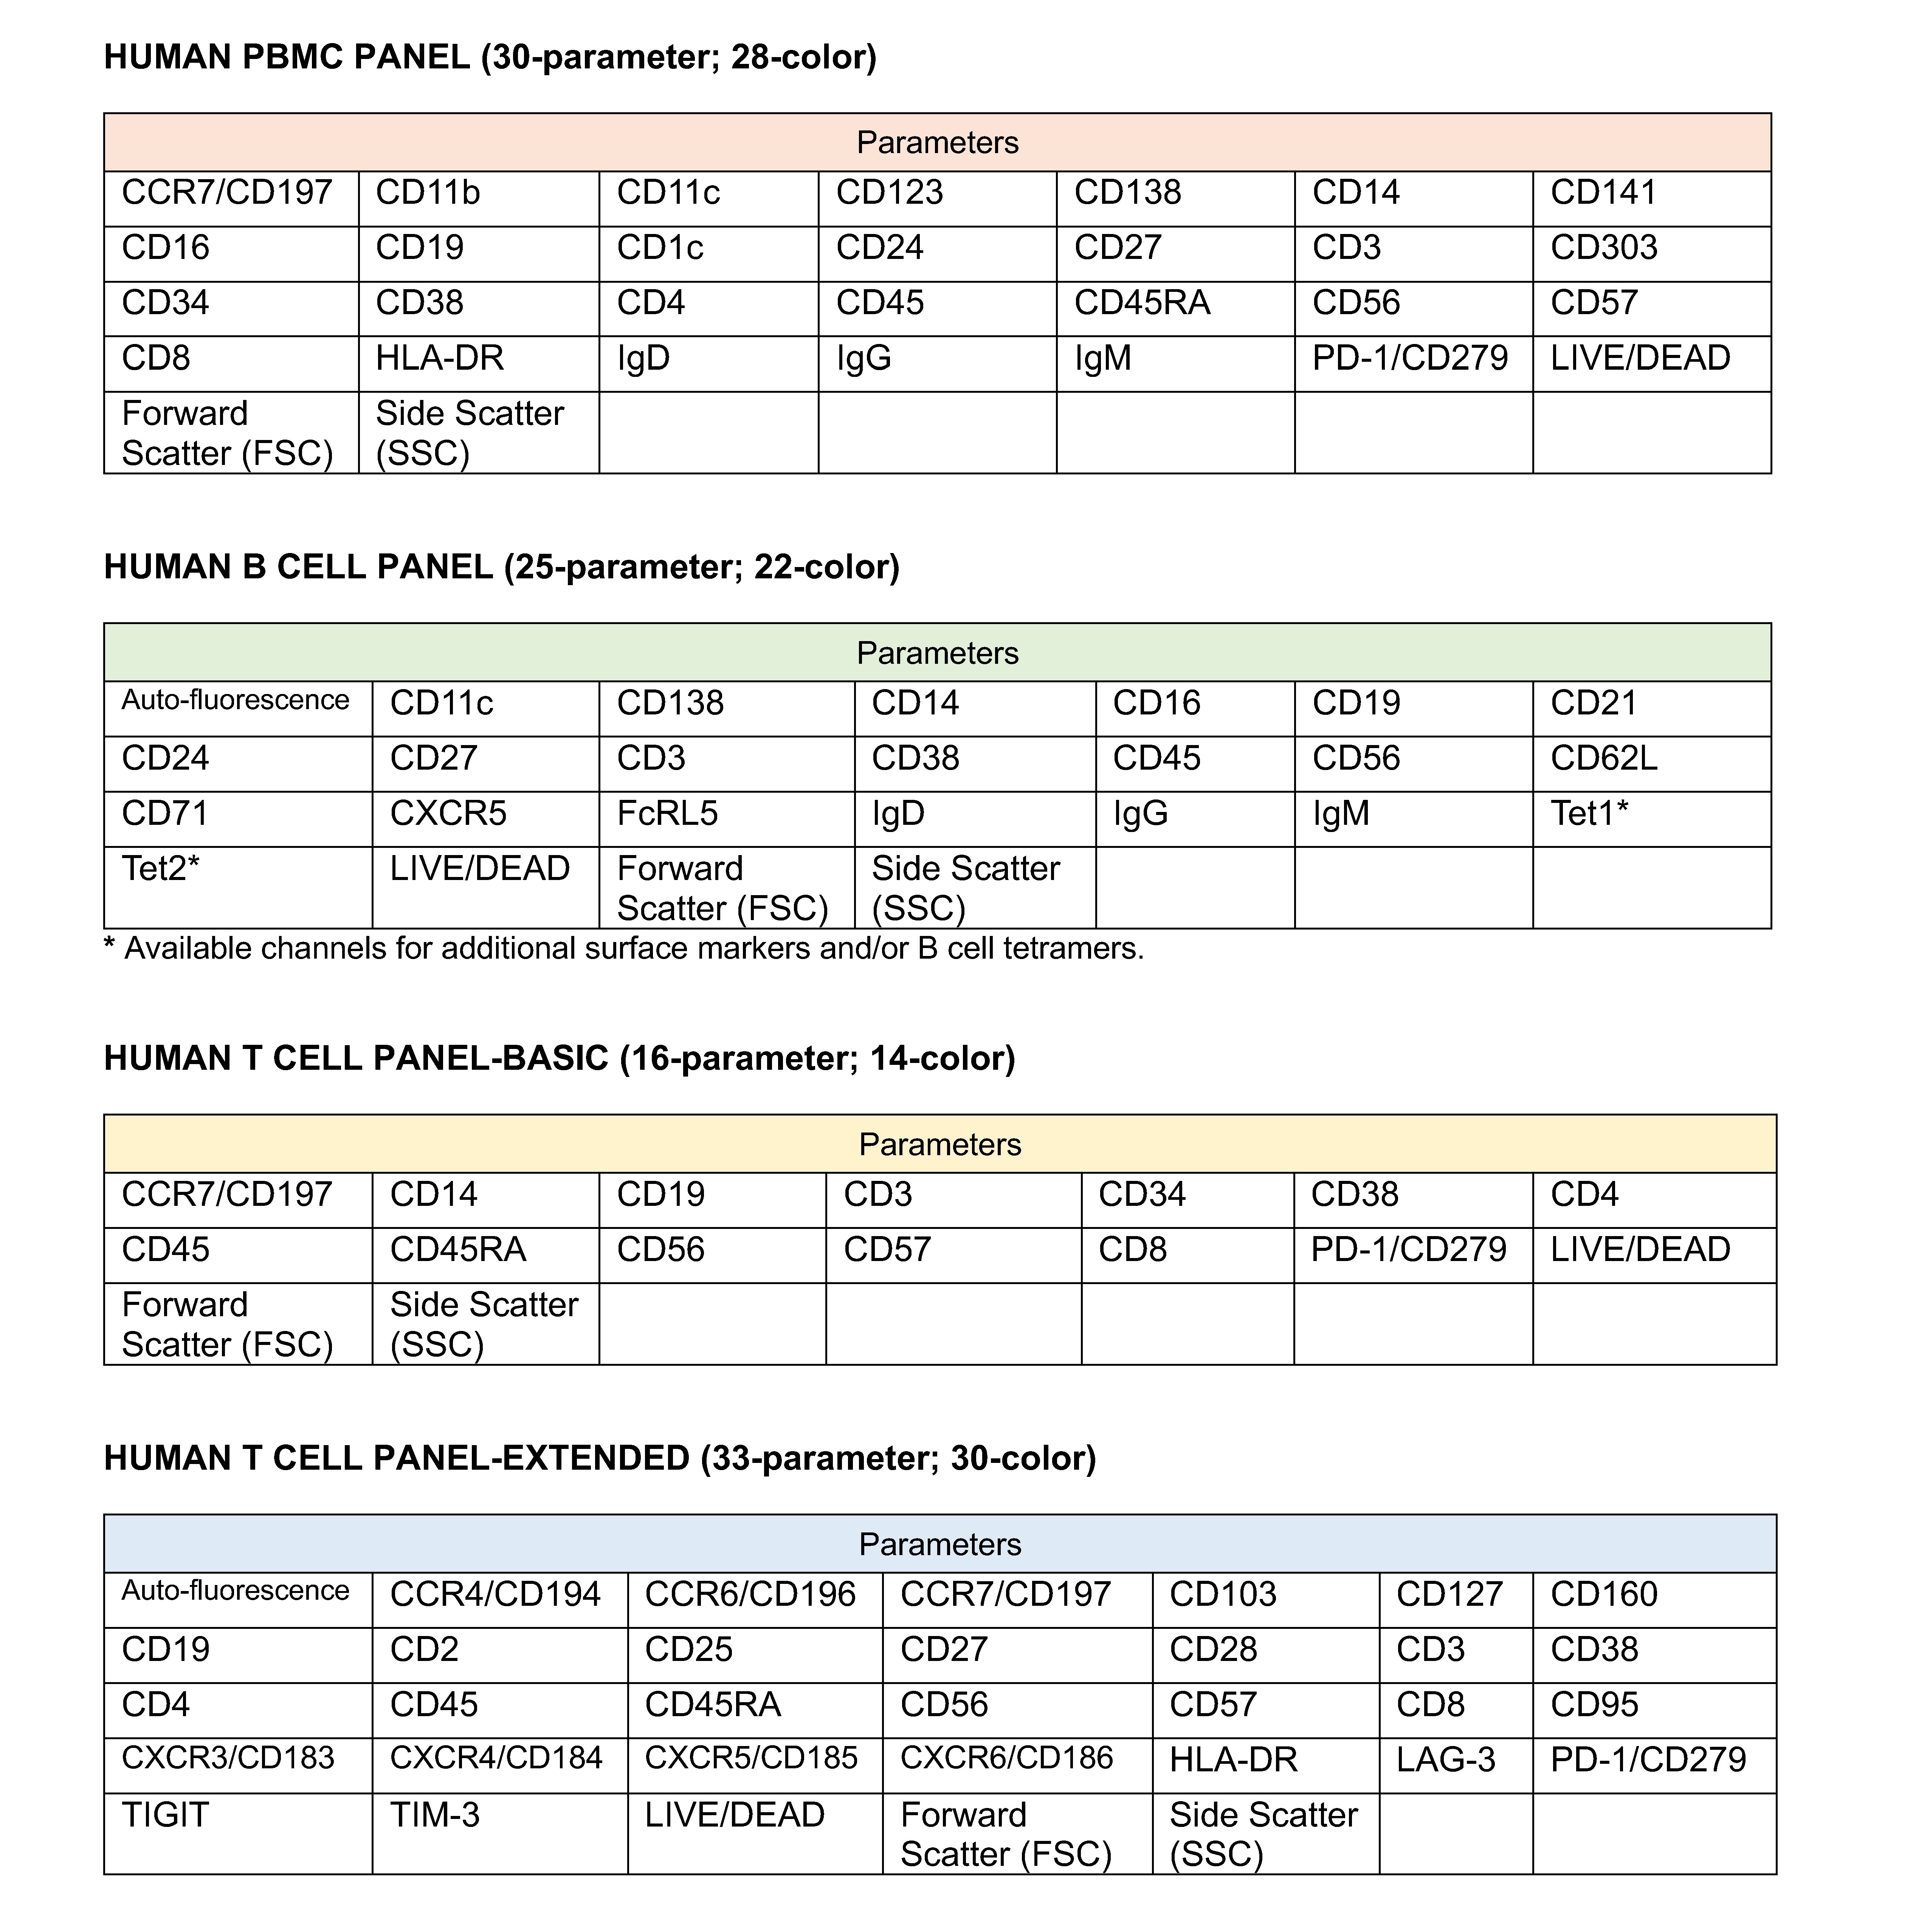
Composition of our validated PBMC, B cell and T cell panels
-
Identification of 64 human immune cell subsets using the PBMC panel
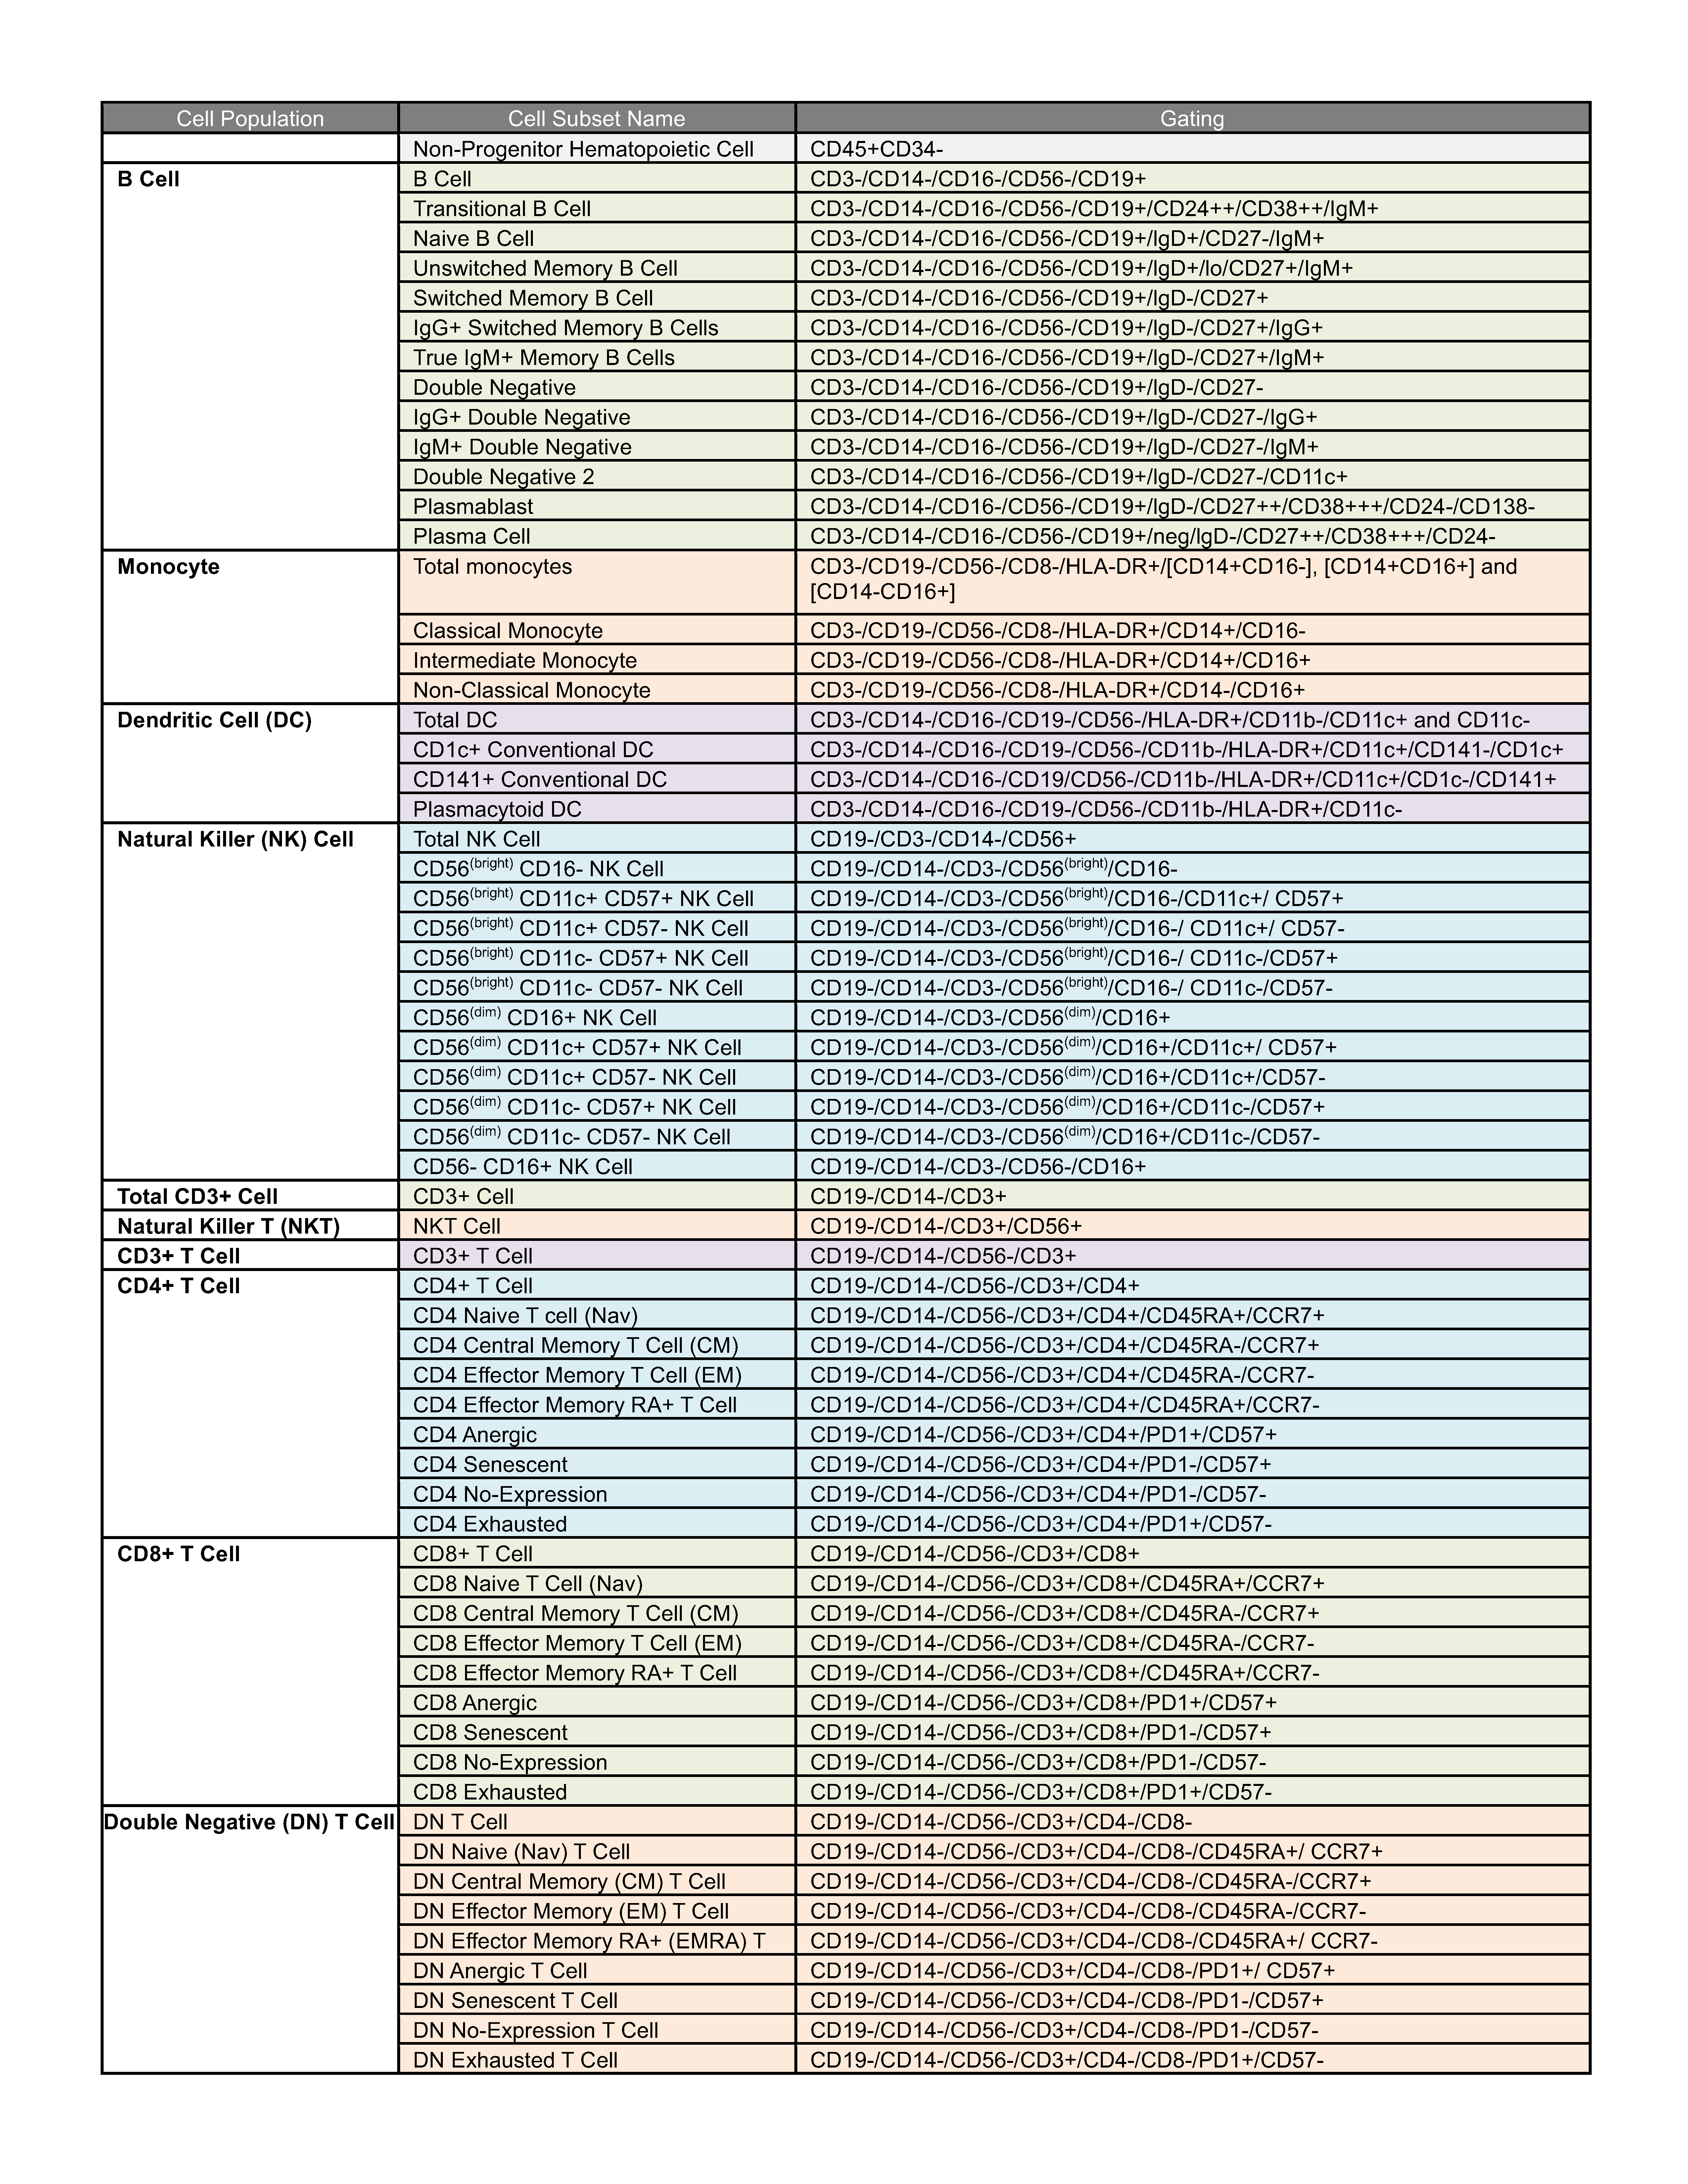
Identification of 64 human immune cell subsets using the PBMC panel
-
Identification of 23+ human B cell subpopulations using the B cell panel
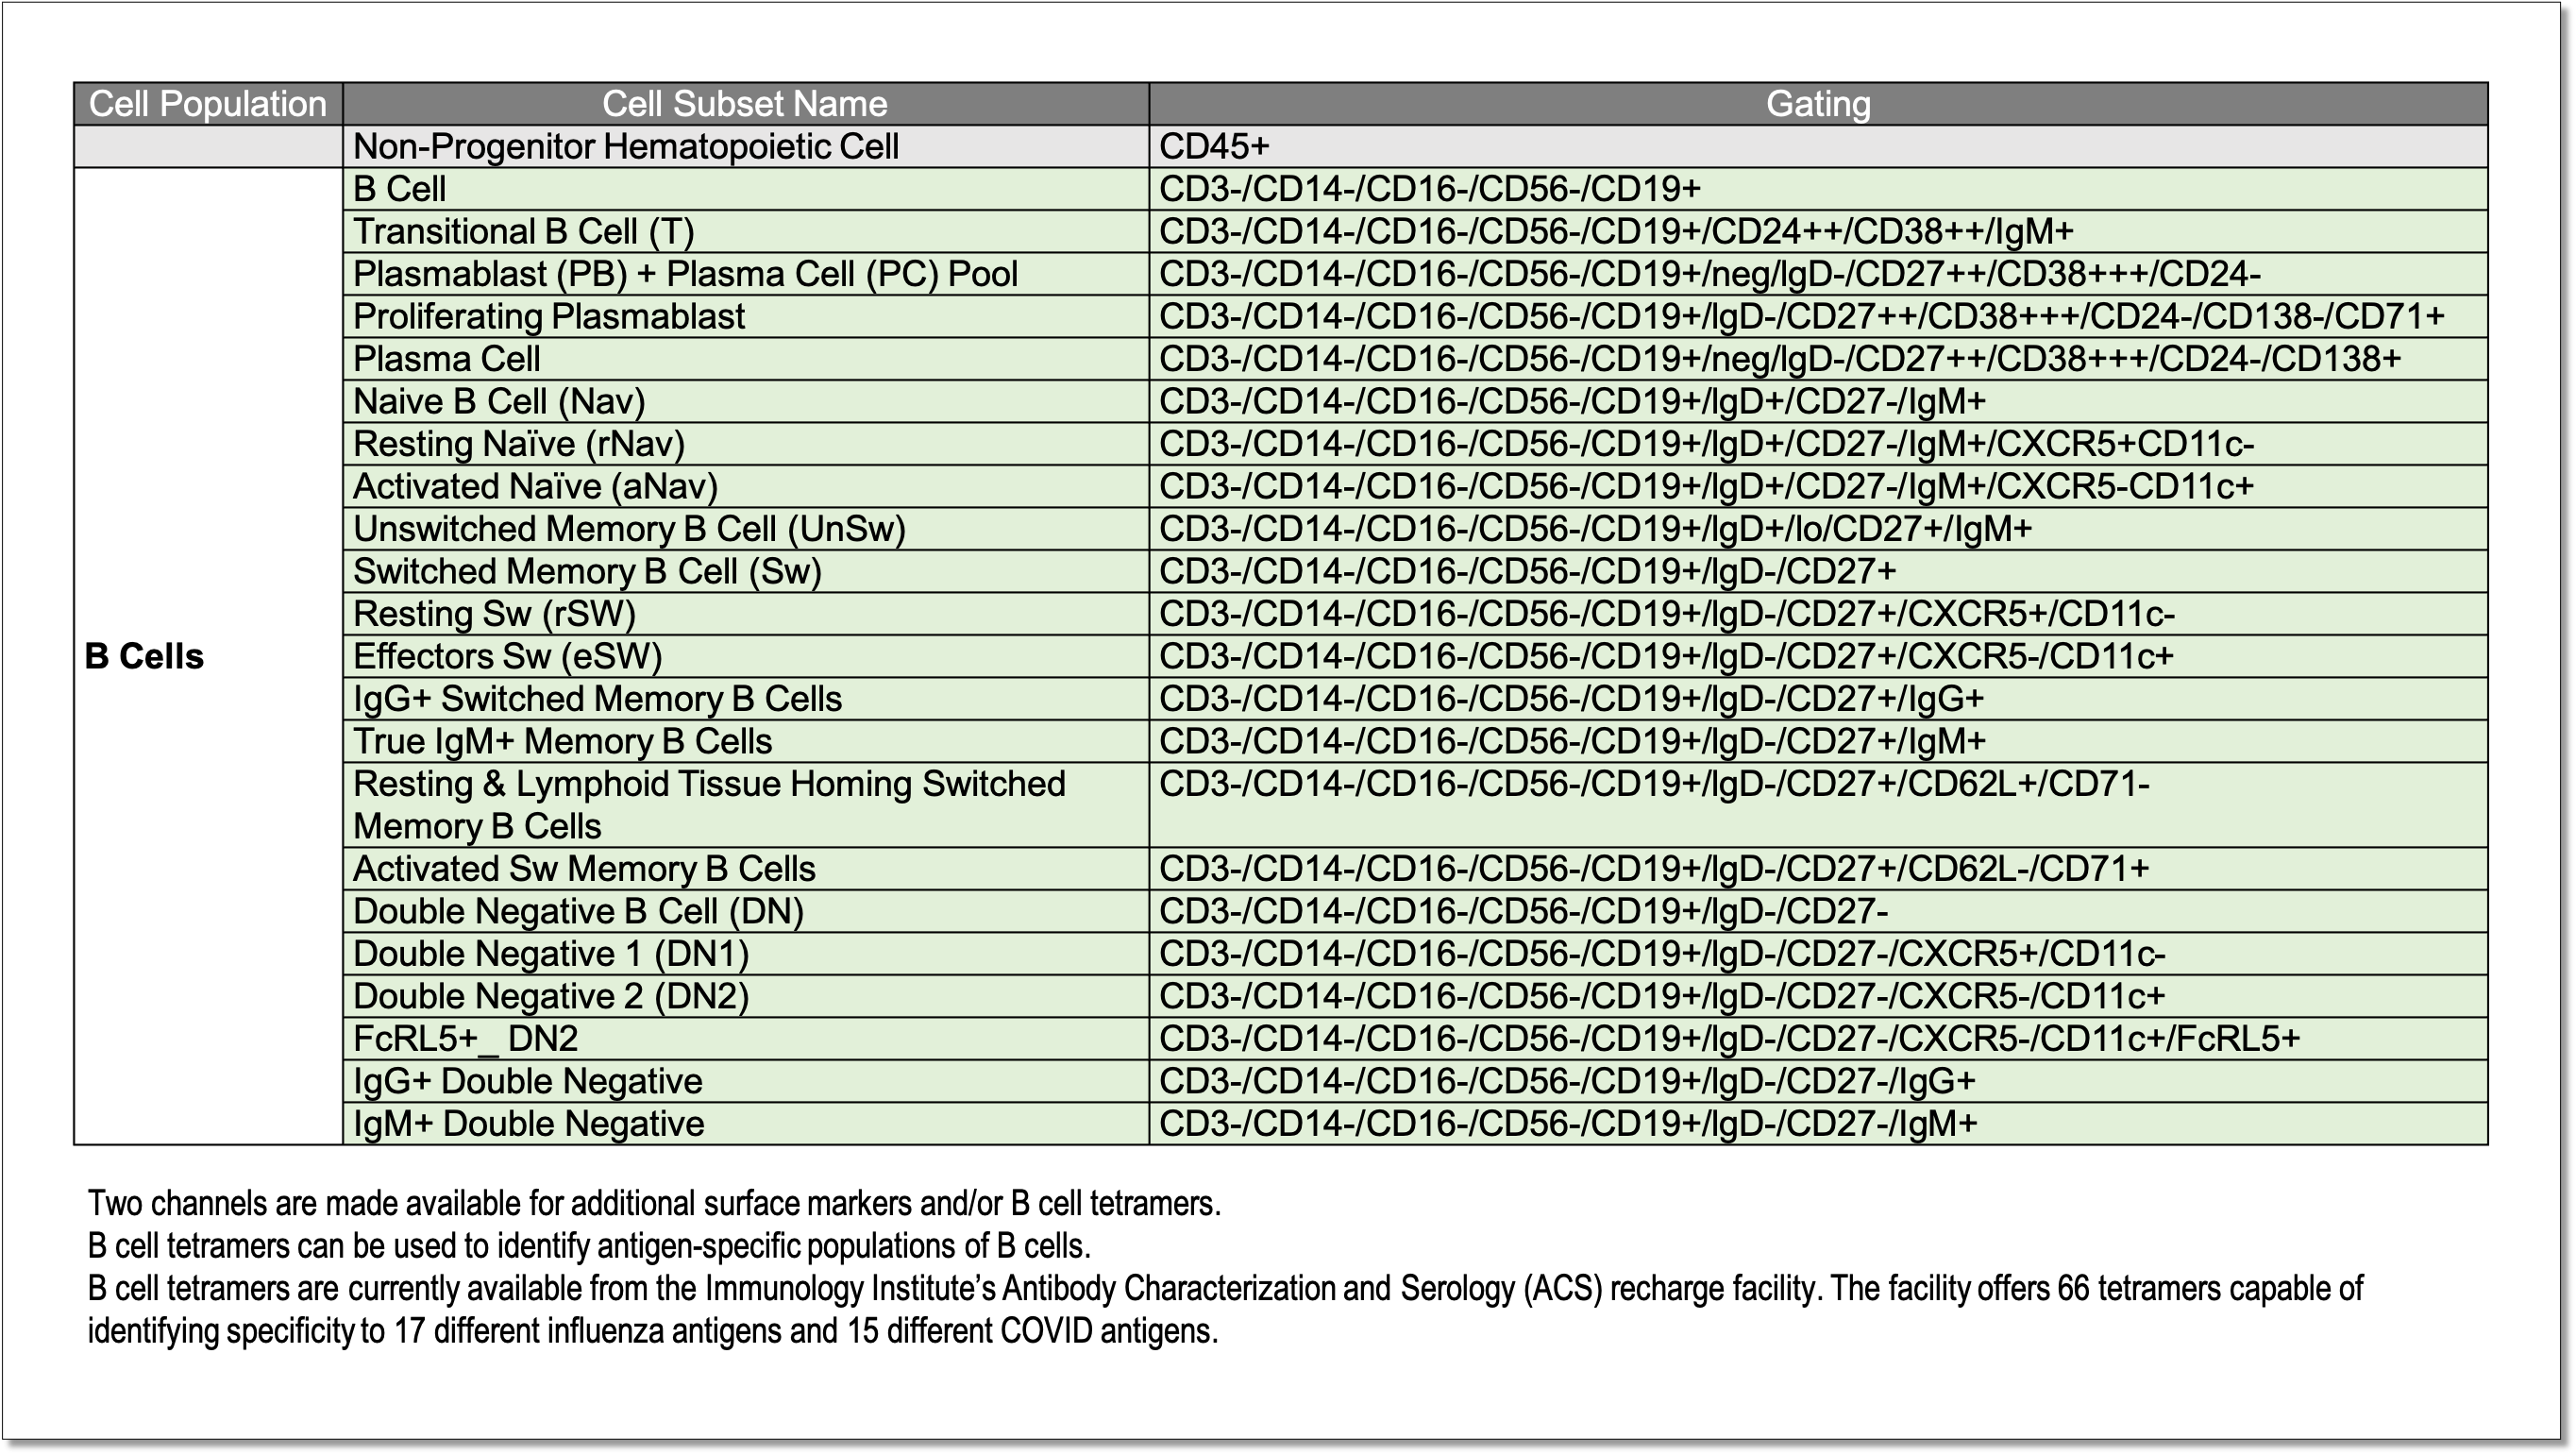
Identification of 23+ human B cell subpopulations using the B cell panel
-
Identification of 20 human T cell subpopulations using the BASIC T Cell panel
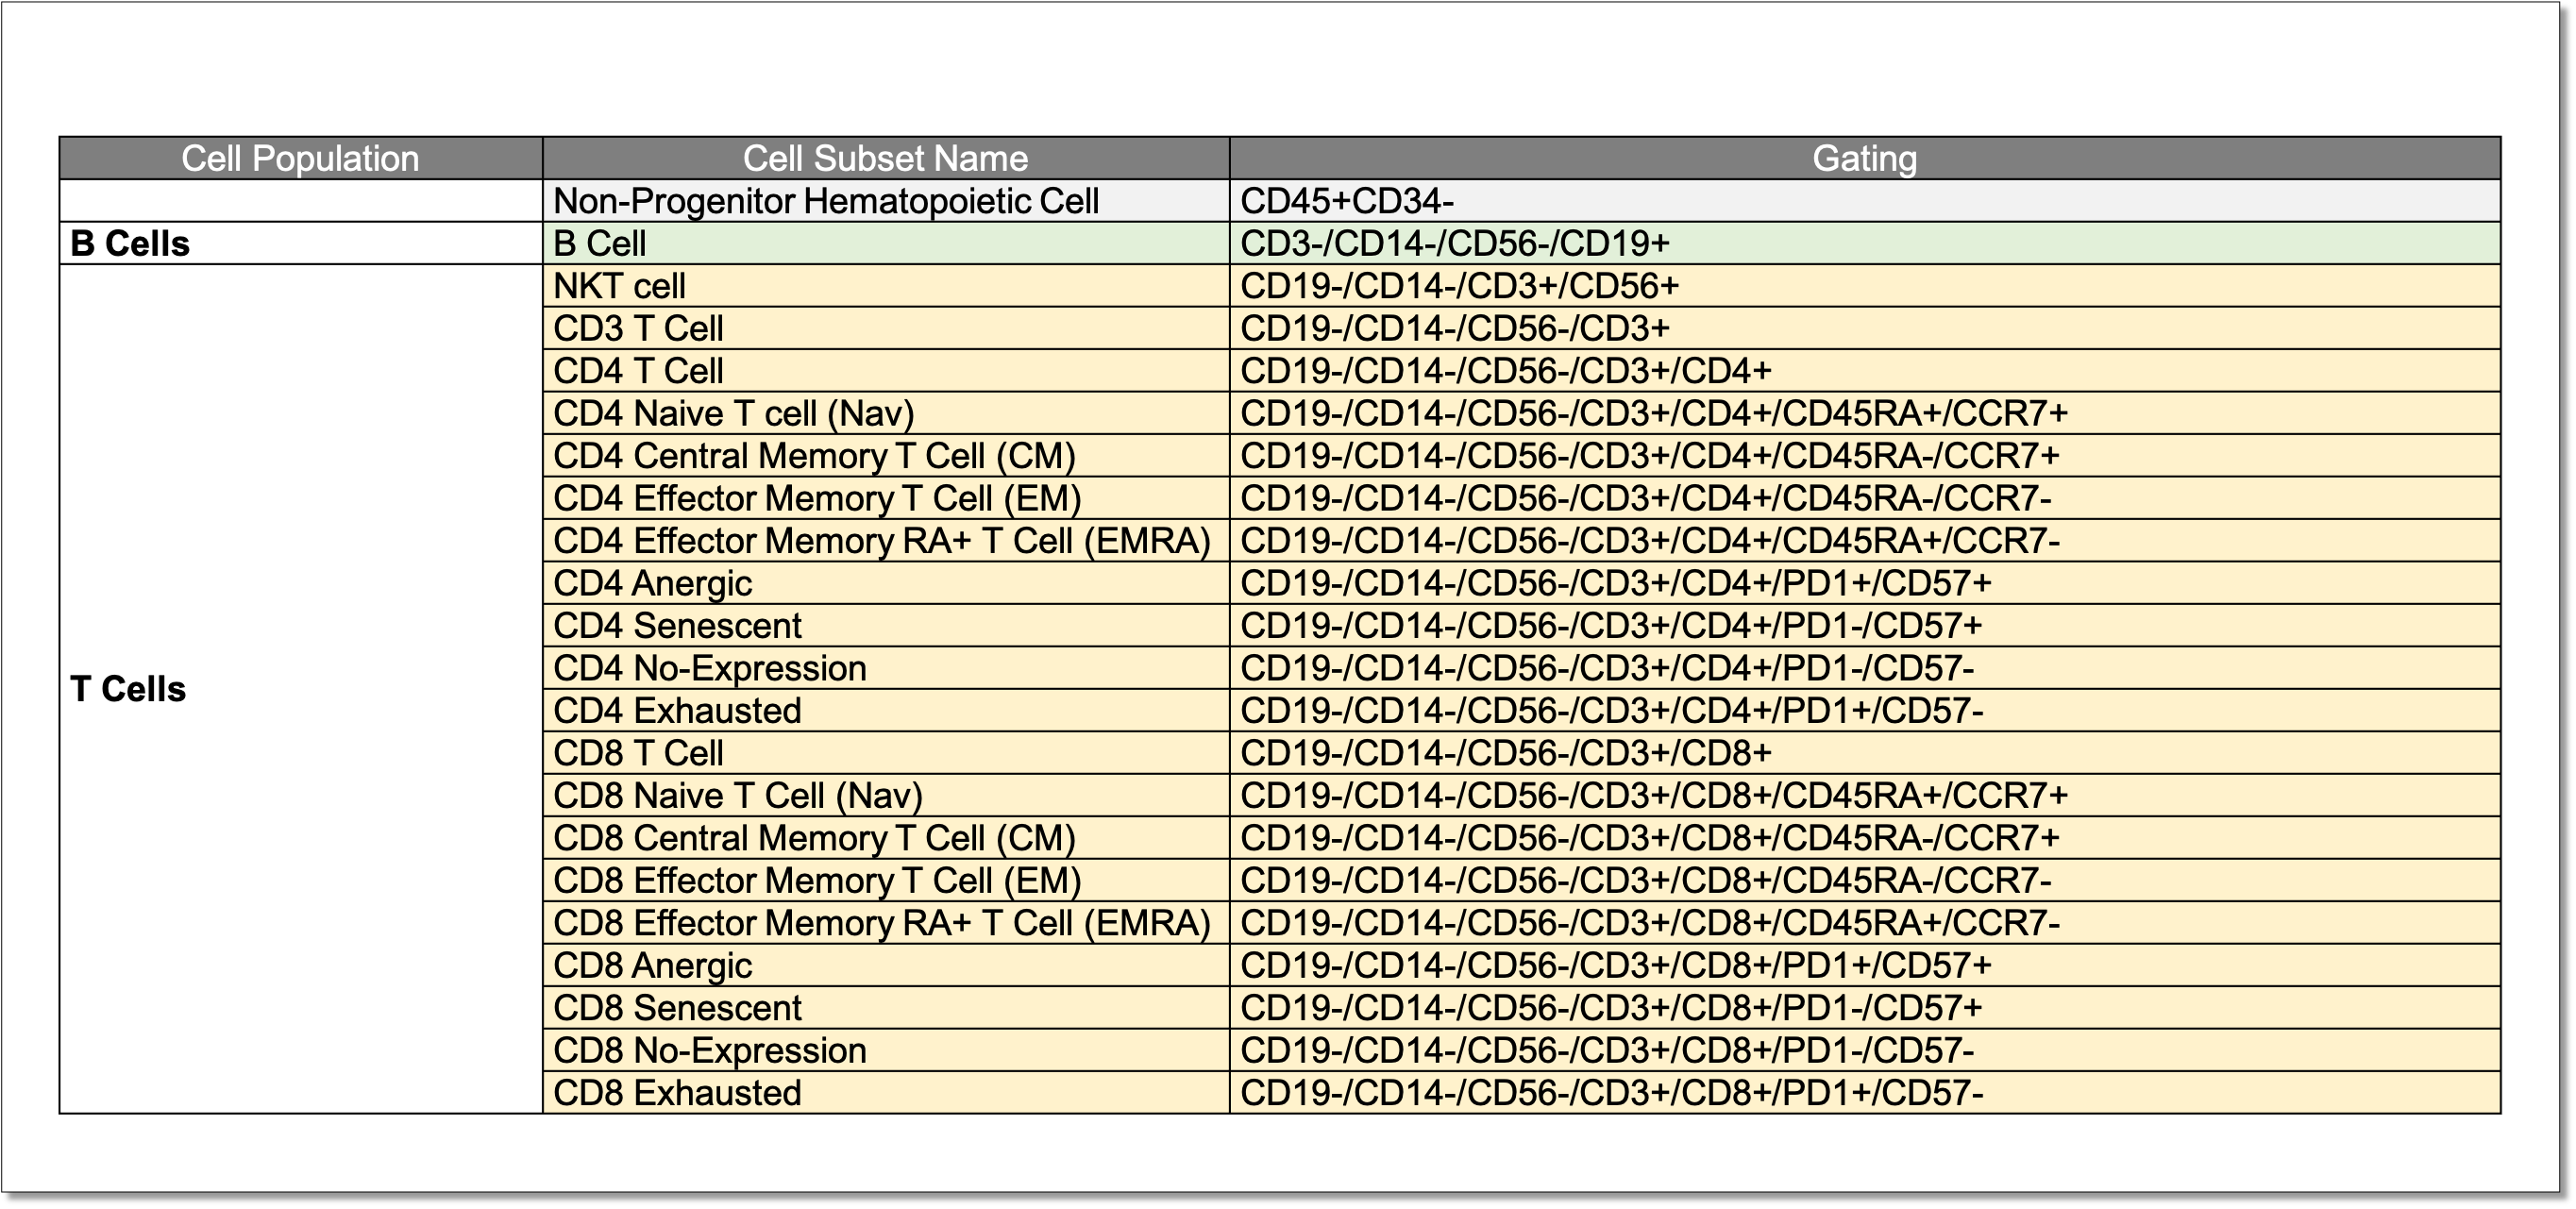
Identification of 20 human T cell subpopulations using the BASIC T Cell panel
-
Identification of 58 human T cell subpopulations using the EXTENDED T Cell panel
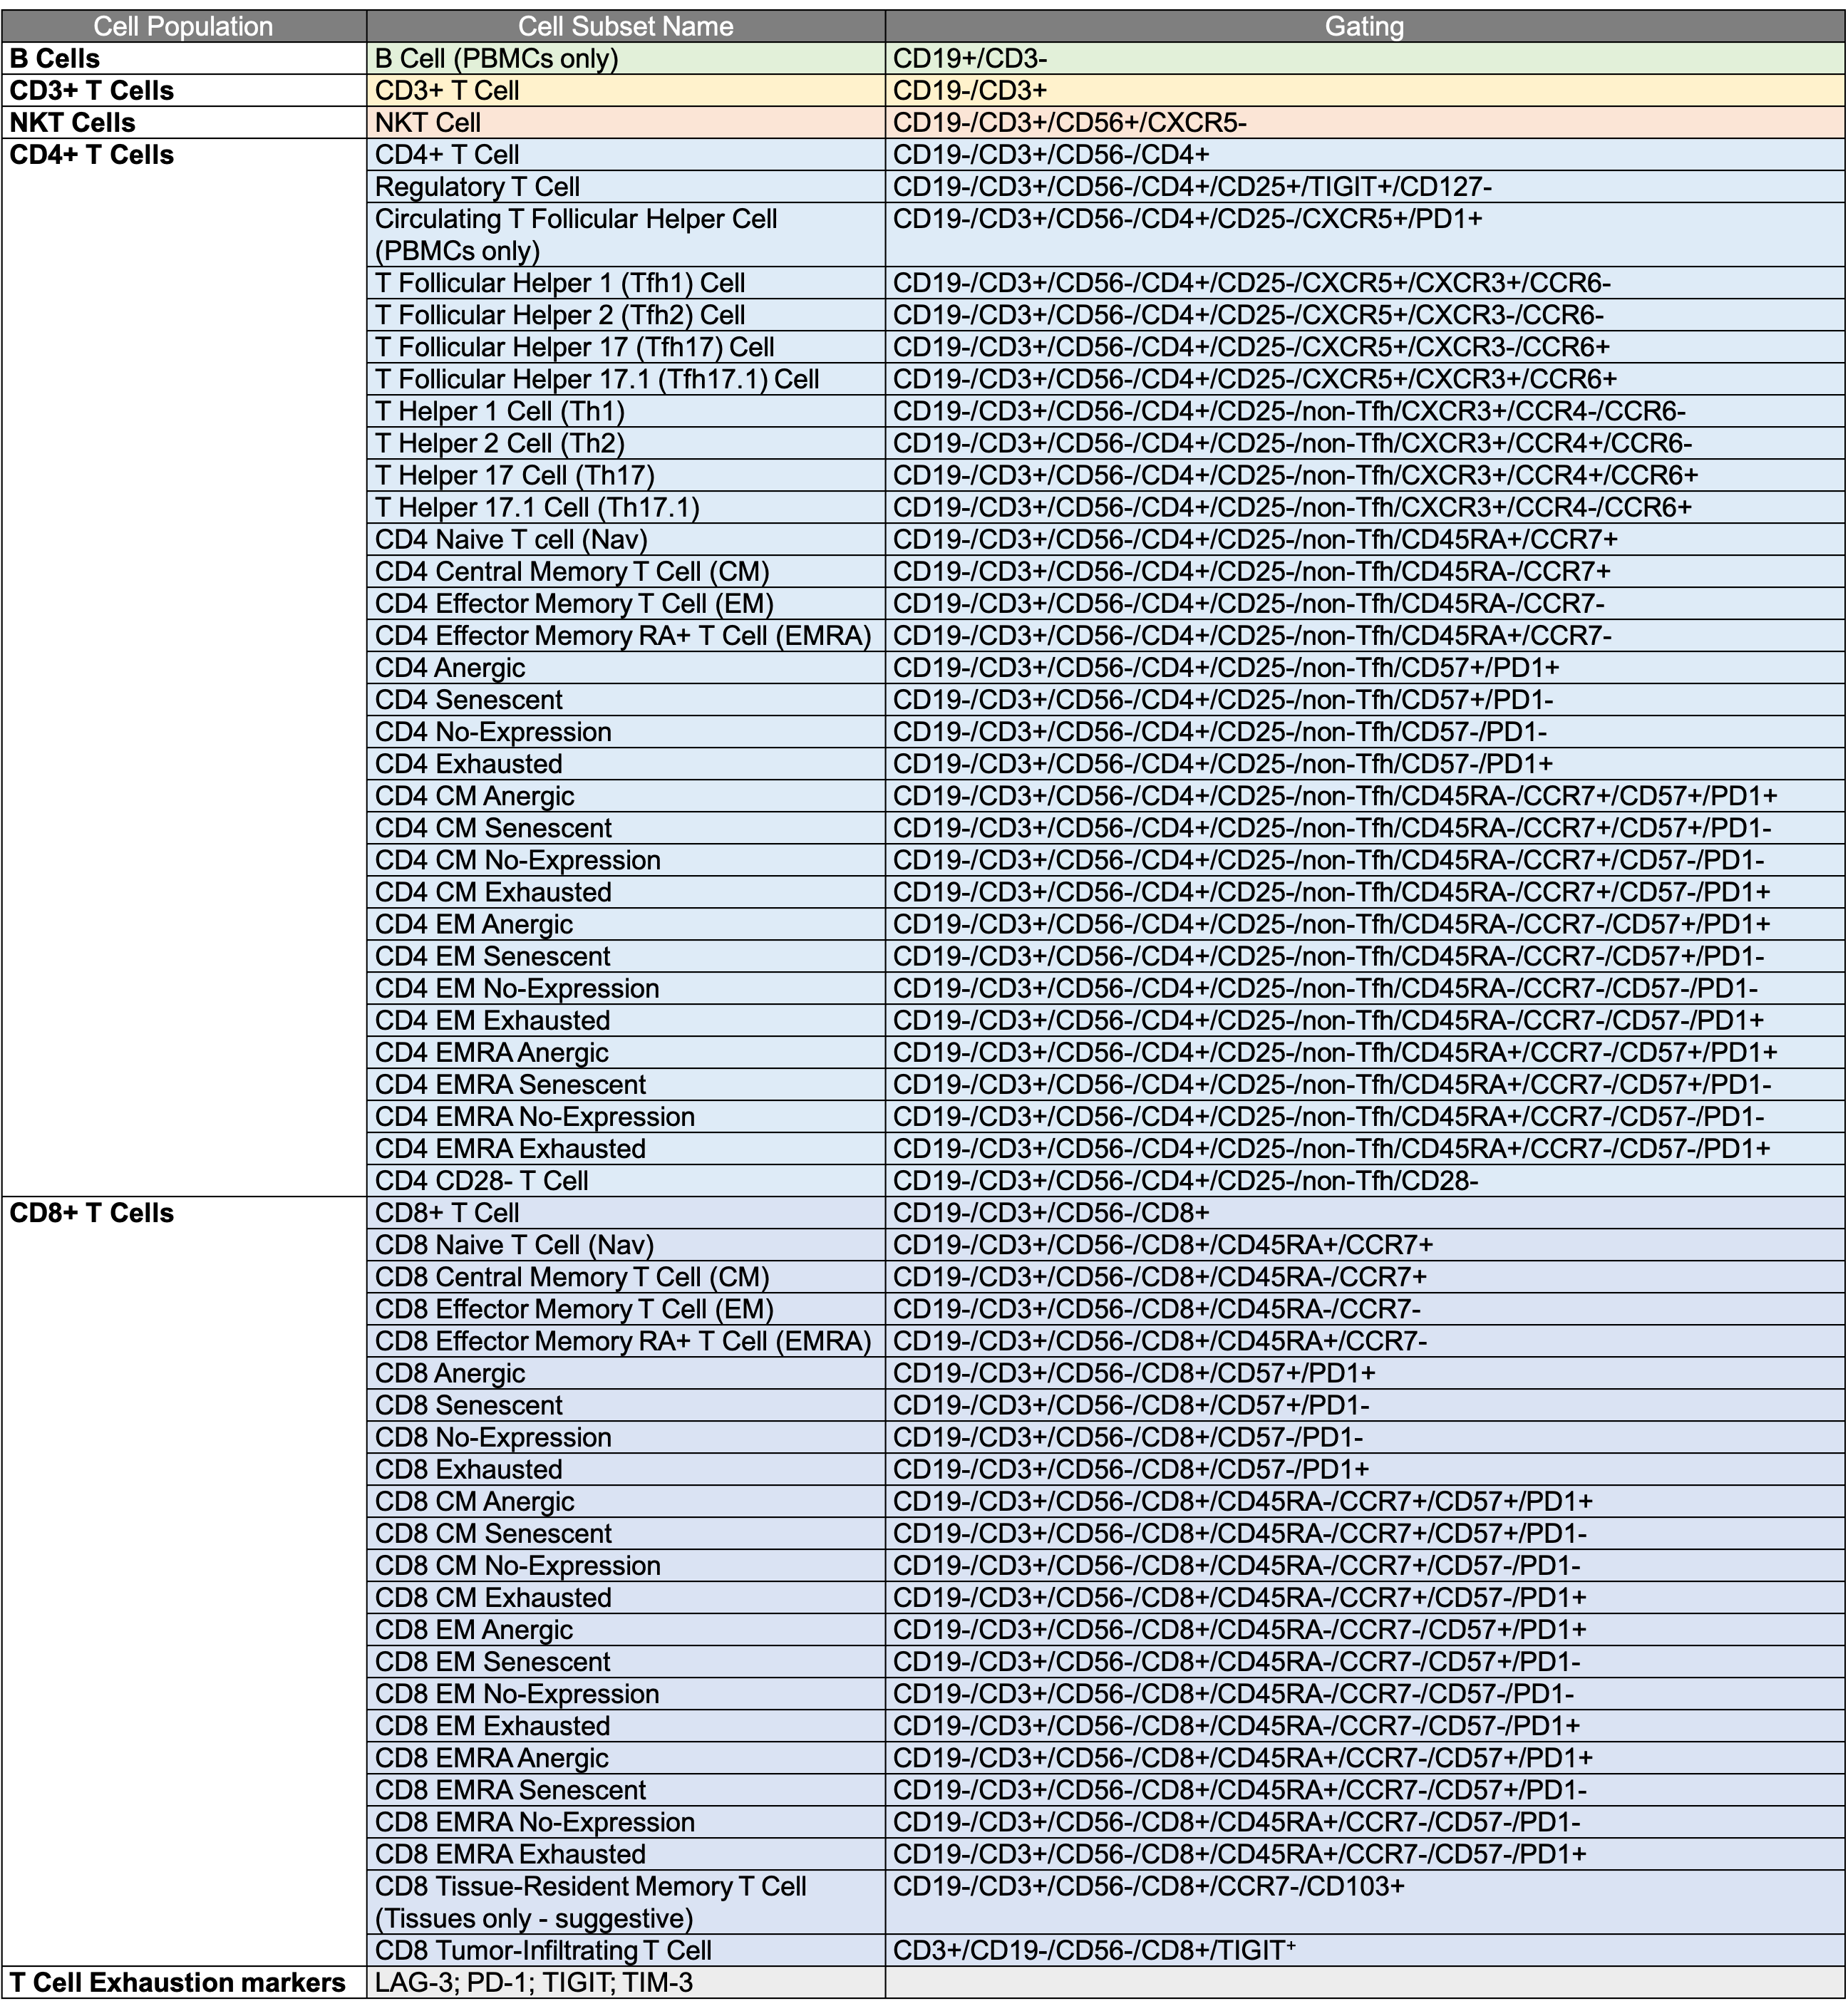
Identification of 58 human T cell subpopulations using the EXTENDED T Cell panel
-
Immunophenotyping services fee schedule
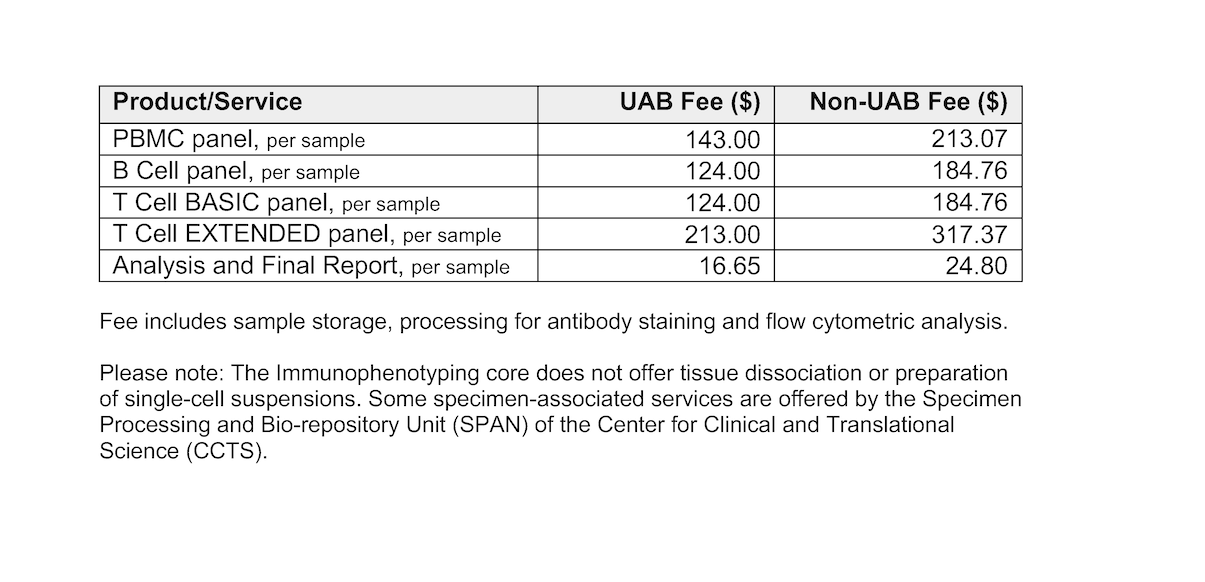
Immunophenotyping services fee schedule
-
Analysis & Final Report (Optional Service)
Analysis & Final Report (Optional Service)
Our Analysis & Final Report service provides standardized, high-quality processing of immunophenotyping data, converting raw flow cytometry files into organized, clearly presented results. This optional service, offered separately from sample processing and data acquisition, focuses on consistent, template-based manual gating and structured data output to support downstream analysis, visualization, and reporting by investigators. This service is particularly valuable for projects without dedicated in-house flow cytometry expertise.
What’s Included
Analysis is performed using FlowJo™ software and includes:
Manual gating of flow cytometry data using pre-established and validated gating templates.
Consistent, semi-supervised application of gating strategies across all samples.
Identification of immune cell subpopulations defined by the selected immunophenotyping panel.
Quality checks to ensure gating consistency and data integrity.
Generation of standardized output files, including:
A spreadsheet reporting the number of events detected for each identified cell subpopulation.
A spreadsheet reporting the frequencies (percentages) of each cell subpopulation.
Deliverables
The final report package will consist of:
Raw FCS files for all submitted samples
Sample quality control (QC) reports
A FlowJo™ workspace file containing the applied gating template and gated cell populations
Two standardized spreadsheets reporting:
The number of events recorded for each identified cell subpopulation
The frequencies (percentages) of each identified cell subpopulation
A master summary spreadsheet including, for each sample:
Percent cell viability
Total number of live cells recovered
Pass/fail assignment based on core-established quality thresholds
Viability ≥ 85%
Live cell count ≥ 1.5 × 10⁶ cells
All deliverables are shared with investigators via UAB Box.
Turnaround Time
Turnaround time for analysis and report generation varies depending on several factors, including the number of samples, the immunophenotyping panel selected, and overall project complexity. Additional considerations such as sample quality, data completeness, and current core workload may also influence timelines. Investigators will be provided with an estimated timeline following completion of data acquisition and will be kept up to date on progress throughout the analysis.
Data Ownership & Confidentiality
Investigators retain full ownership of their data. All datasets are handled securely and confidentially, with support available for journal or funding-agency data-sharing requirements.
How to Request Analysis
Please indicate your interest in the Analysis & Final Report service at the time of project submission or contact us to schedule a consultation prior to study initiation.
-
Point of contact
Point of contact
Davide Botta, PhD
Research Manager
HSOM Immunology Institute
dbotta@uab.edu
SHEL 575A